OS Resilience Dashboard
A B2B portal & a central hub for Ordnance Survey's mapping UI with built-in activity feeds, analytics, security & permissions.
OVERVIEW
The brief was to create a dash for the UK Cabinet Office civil emergency team (COBRA) stakeholders. The idea was if an emergency emerged it can be tracked & points to various mapping interfaces to allow them to share the data freely & securely with teams like the police, fire service, HM Coastguards & RNLI.
WHAT WAS INVOLVED
Research
Persona's
User Journey
User Stories
Screen flows
Wireframes
UI Visual Design
Prototyping
ROLE, CLIENT & DURATION
Lead UI/UX Product Designer
3 months (during 2016-2017)
Web, mobile and tablet
Ordnance Survey
The Problem
Maps were stored all over the place making it hard to track, most had no idea where the maps were stored, accessed or who was viewing them, and data was not being shared securely by teams.
Challenges
Lots of complex data to simplify, COBRA teams needed to be able to quickly & intuitively be onboarded to the platform as a need for logging emergencies needed to be handled asap.
Solution
Build a dashboard that integrates easy sharing of information & all mapping apps that OS use for the resilience community.
Key Factors
Having spoken to users the main issue was having access to data in one place that you can share
ACCESS TO MAPS
Access all of the OS .gov mapping products in one portal
ANALYTICS DATA
Data from who has viewed the maps, how long for & where from
SECURITY
Safe sharing of data, having secure permissions for info created.
Users Needs & Goals
Performed quantitative research via surveys & received 30 responses from B2B users, generated a survey report highlighting the needs & frustrations that all users are currently experiencing. Also went & physically spoke to the users about their problems & needs.
“I want to know everything that is going on in one place to keep track of incidents as they appear & share information securely” 42 yo, Police, David
“Our goal is to keep people's lives safe, I want a way of tracking & sharing what is happening locally to raise awareness for others in the community that can provide help when needed” 36 yo, RNLI, Bethany
“Getting first-hand reports that I can raise to commuters lets us inform people beforehand of issues that may occur, this saves our time and people's time. Sharing information with the community extremely is powerful" 30 yo, TFL Traffic Control, Sam
Insights
Users want top Security
Safe sharing ability
Activity feeds
Analytics information
Key Insight - All maps in one place, safe sharing of info/data & security permissions.
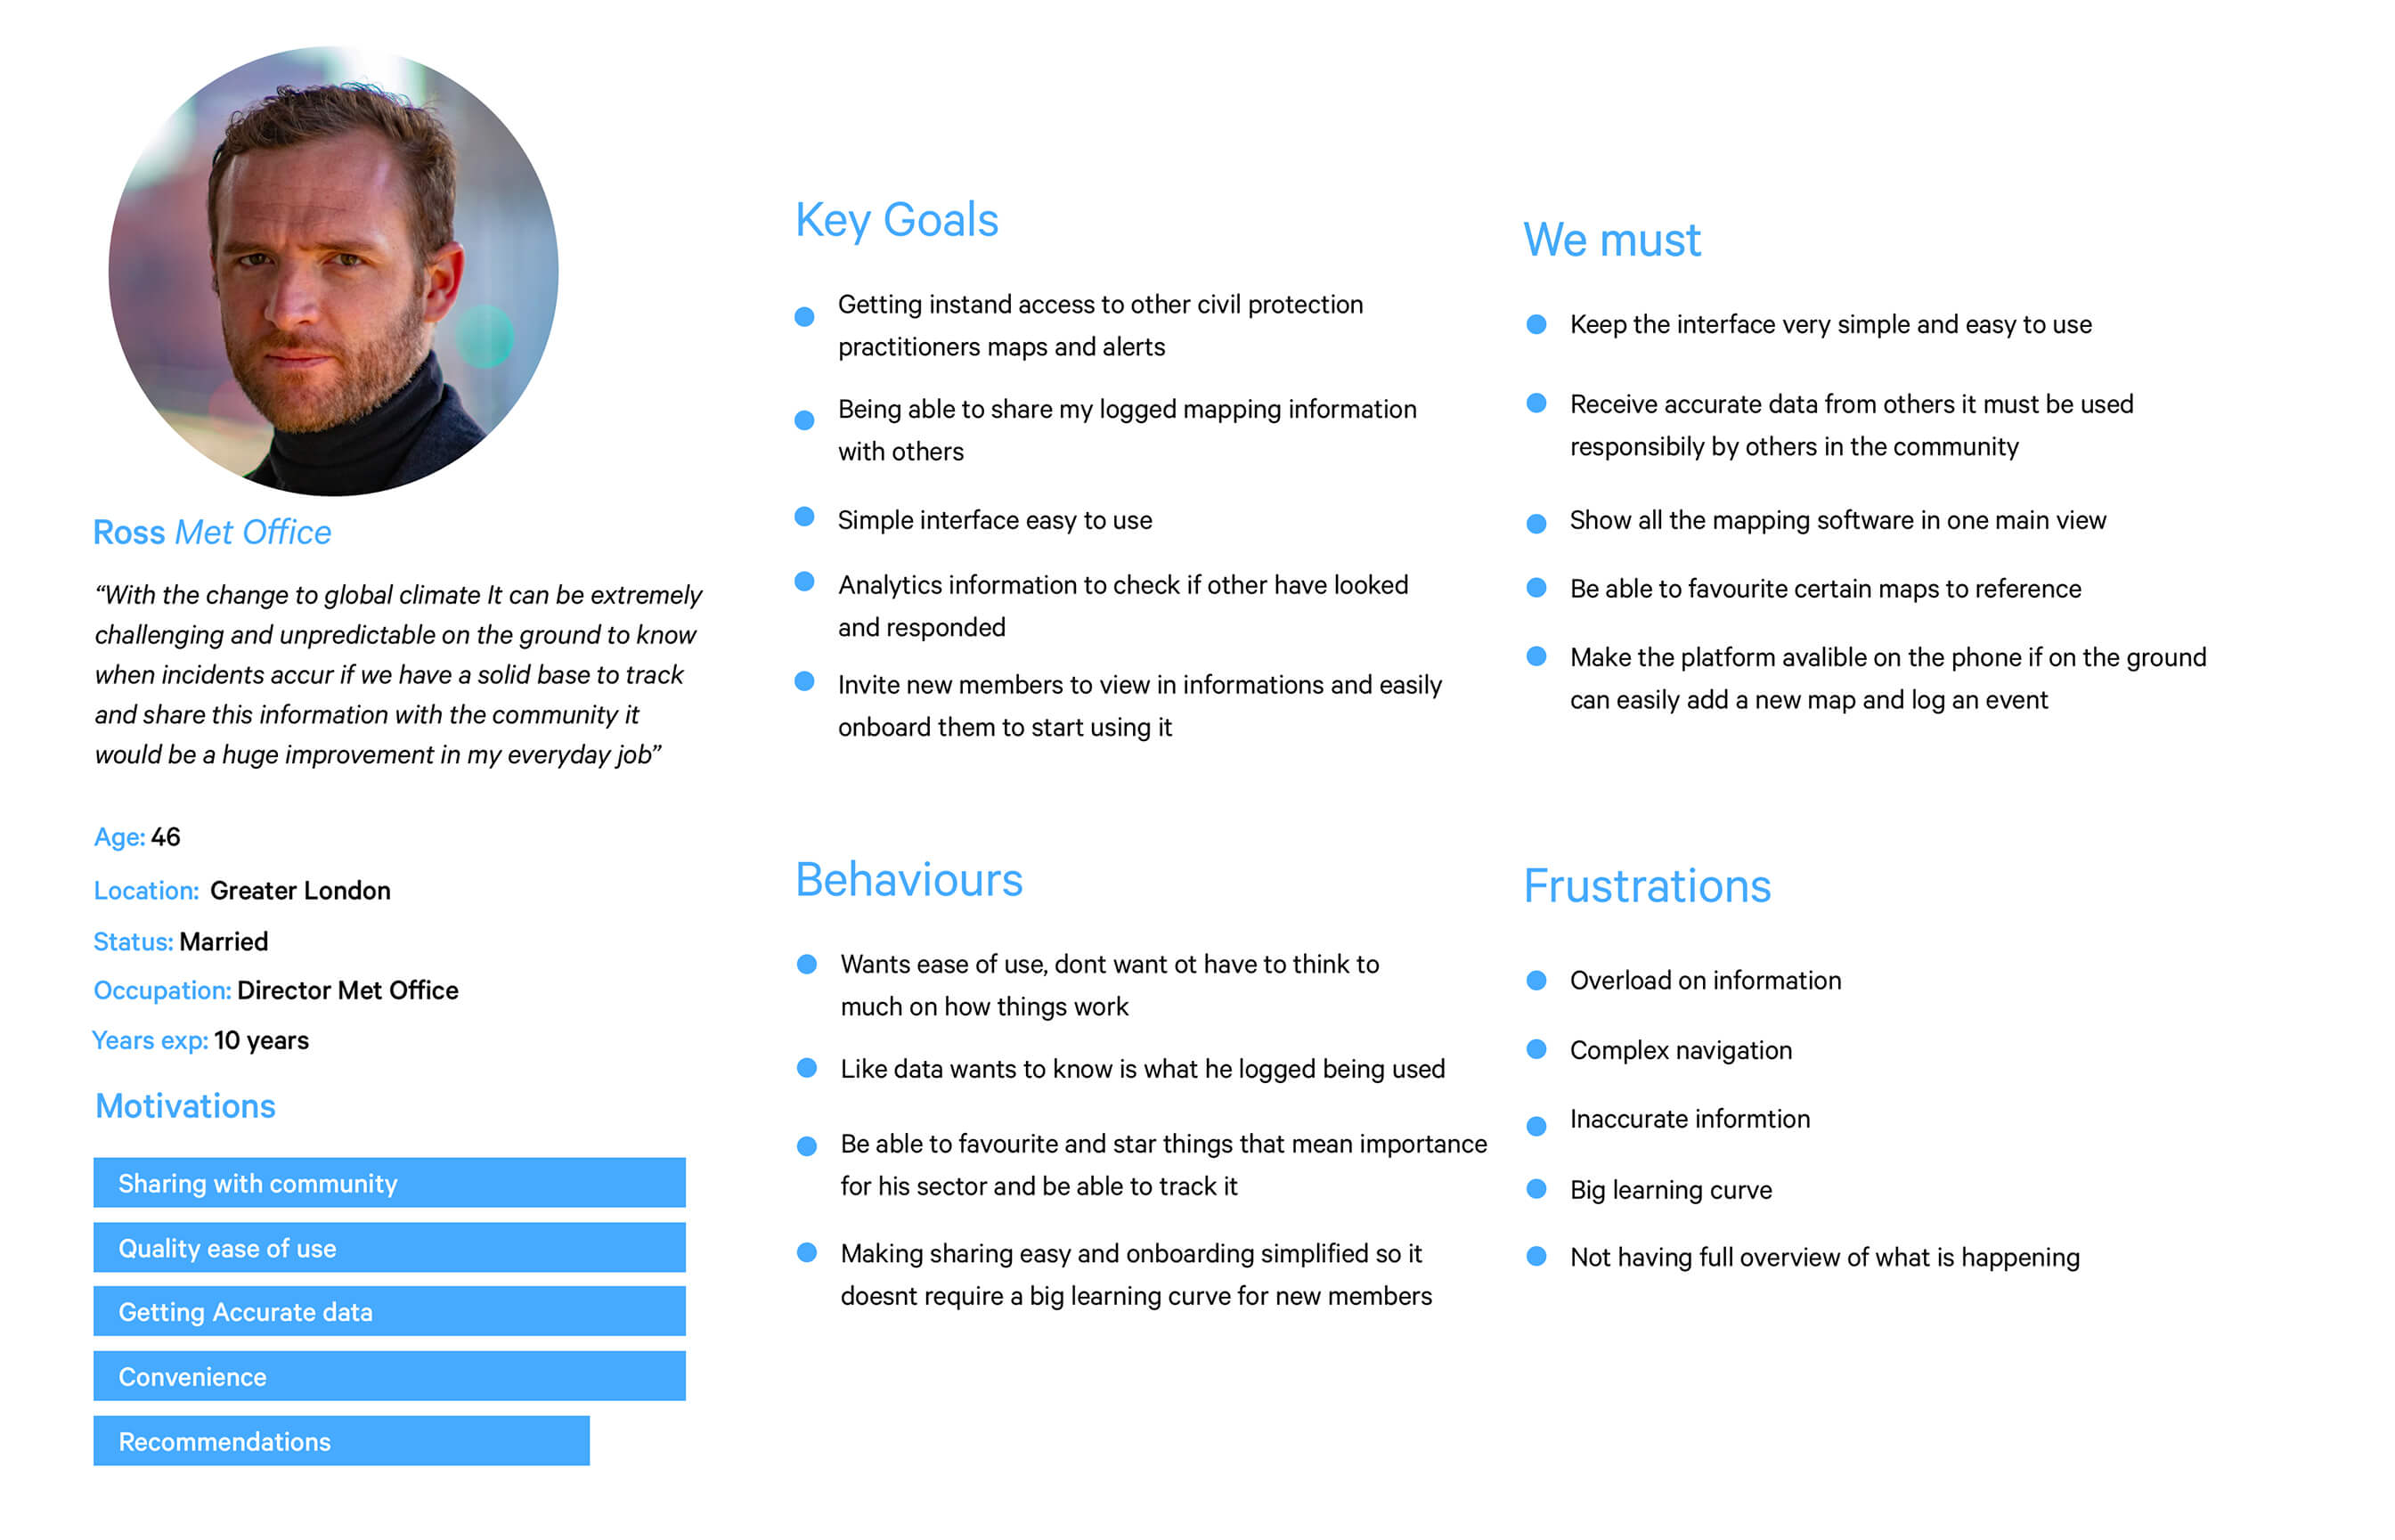
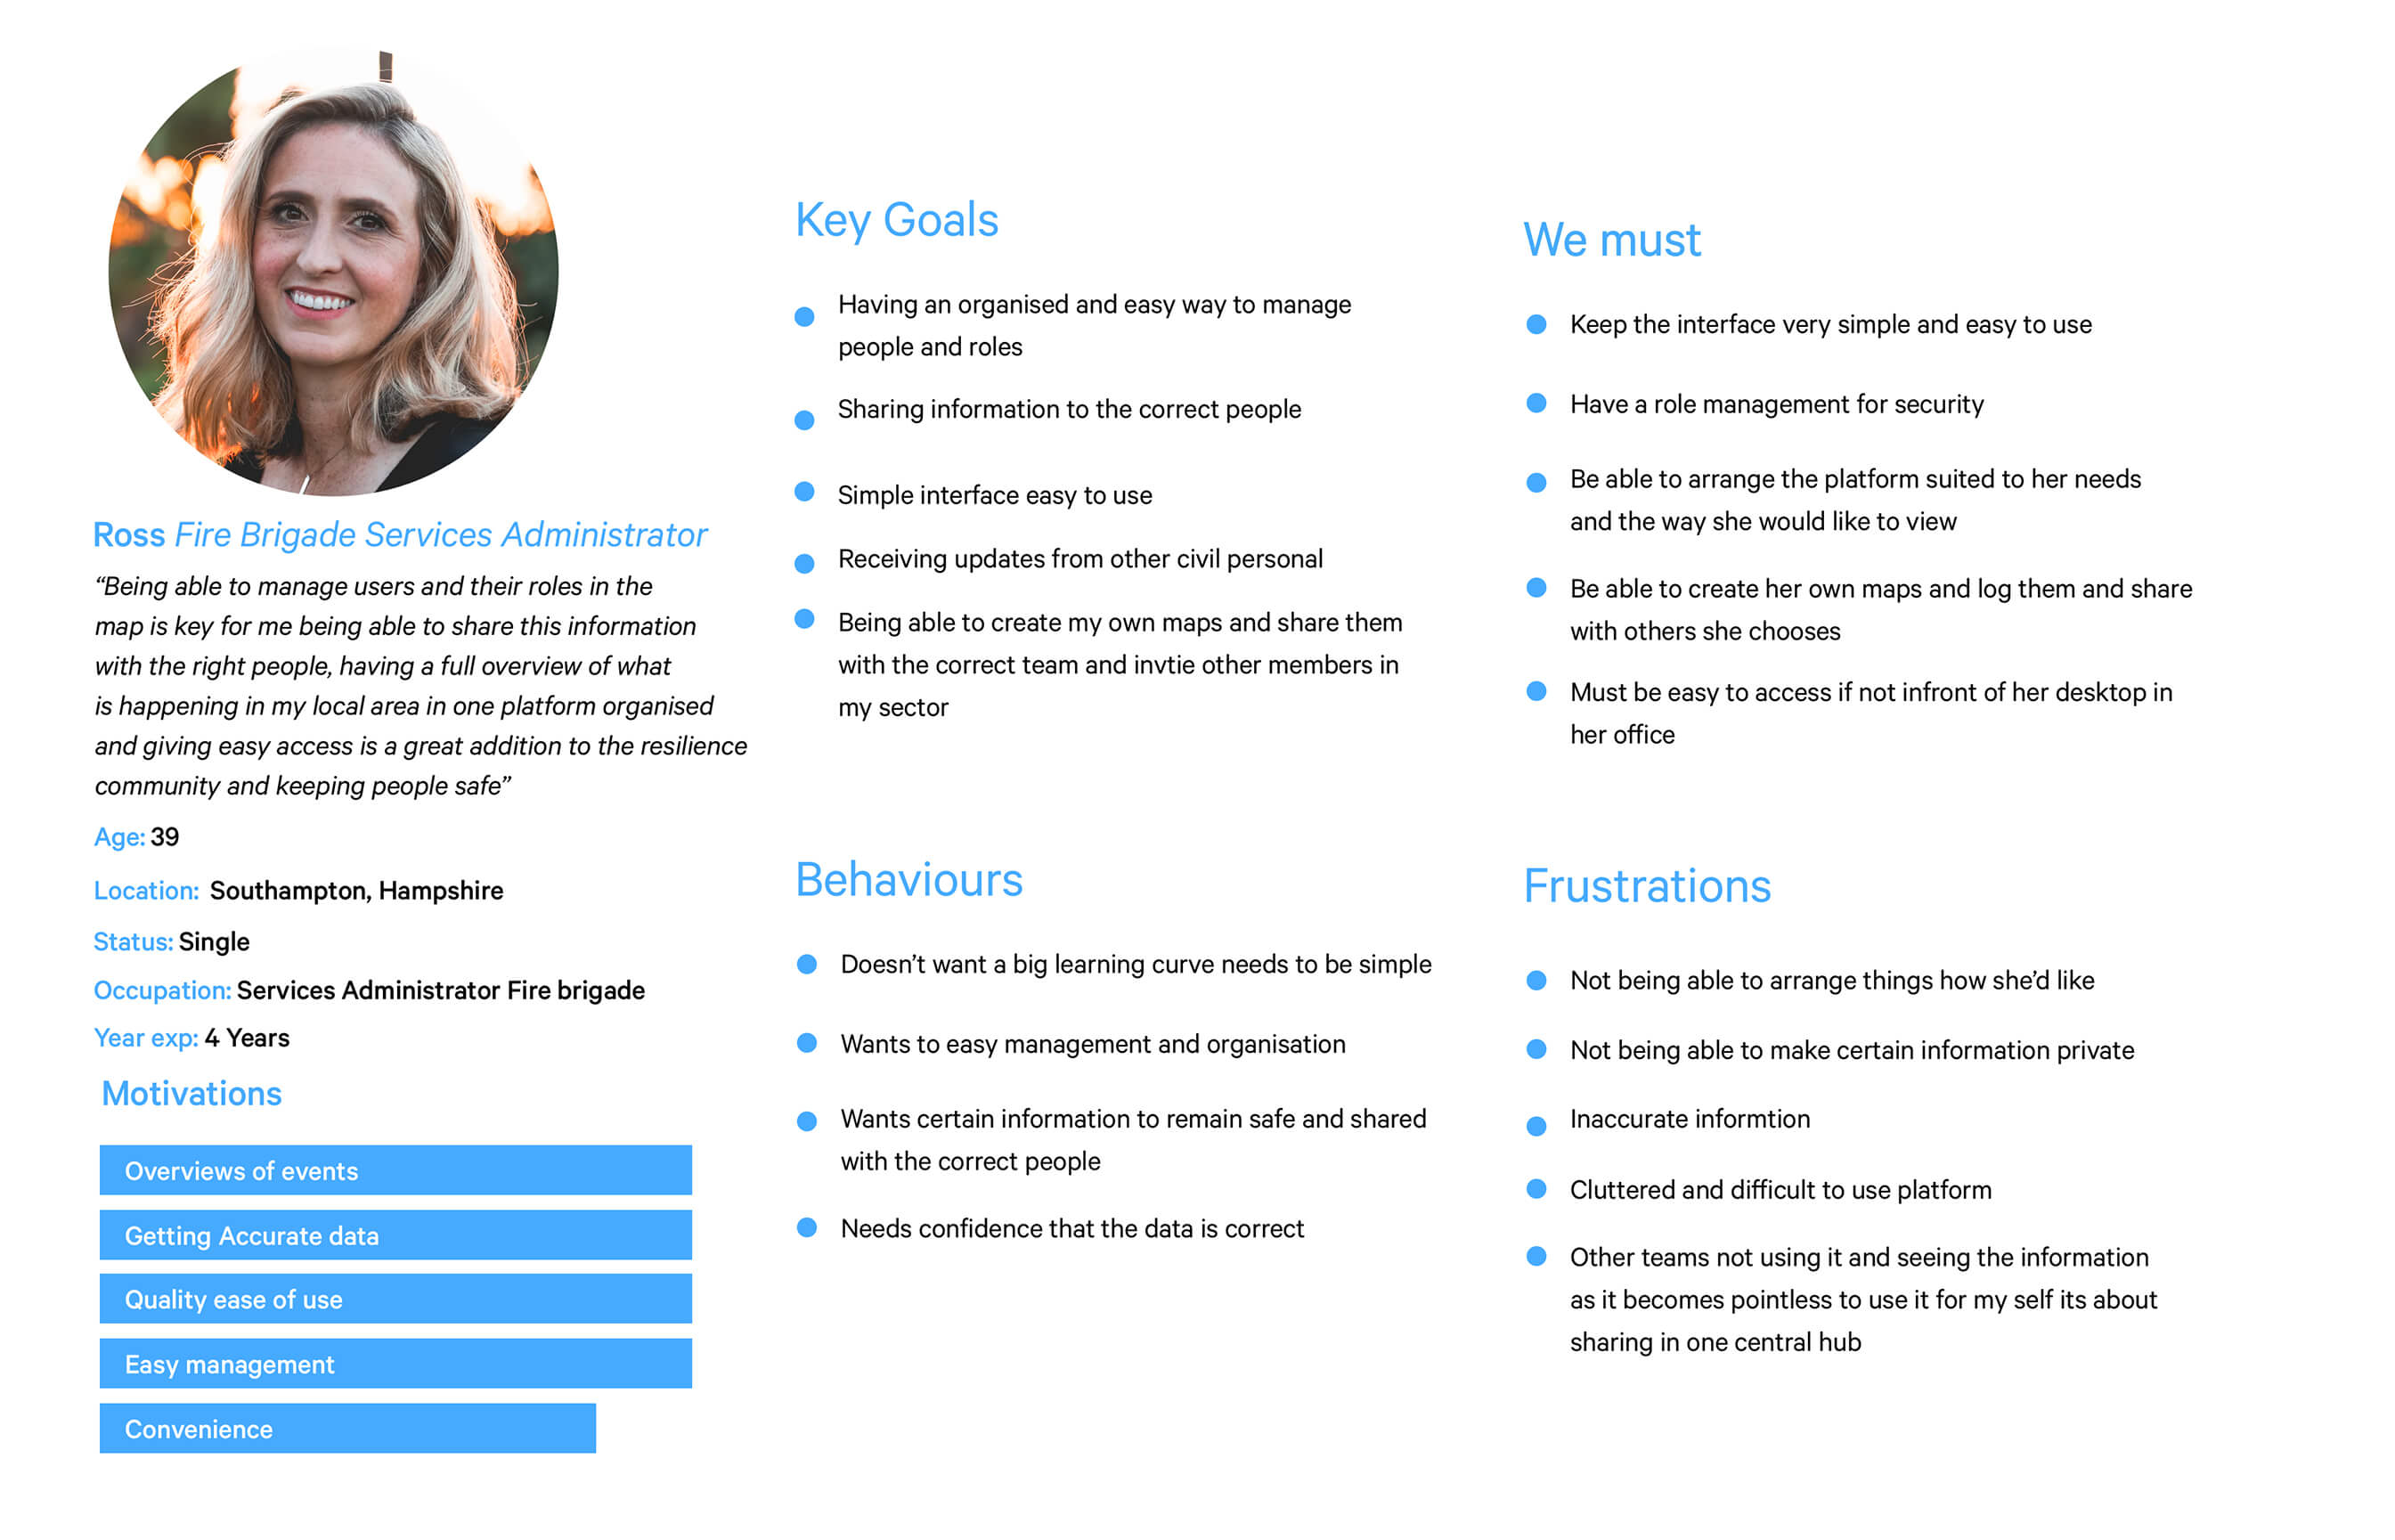
Discovery - Persona's
From the research data, I created sets of personas which were shared with stakeholders & used to relate to make sure I build the platform to address the user's needs.
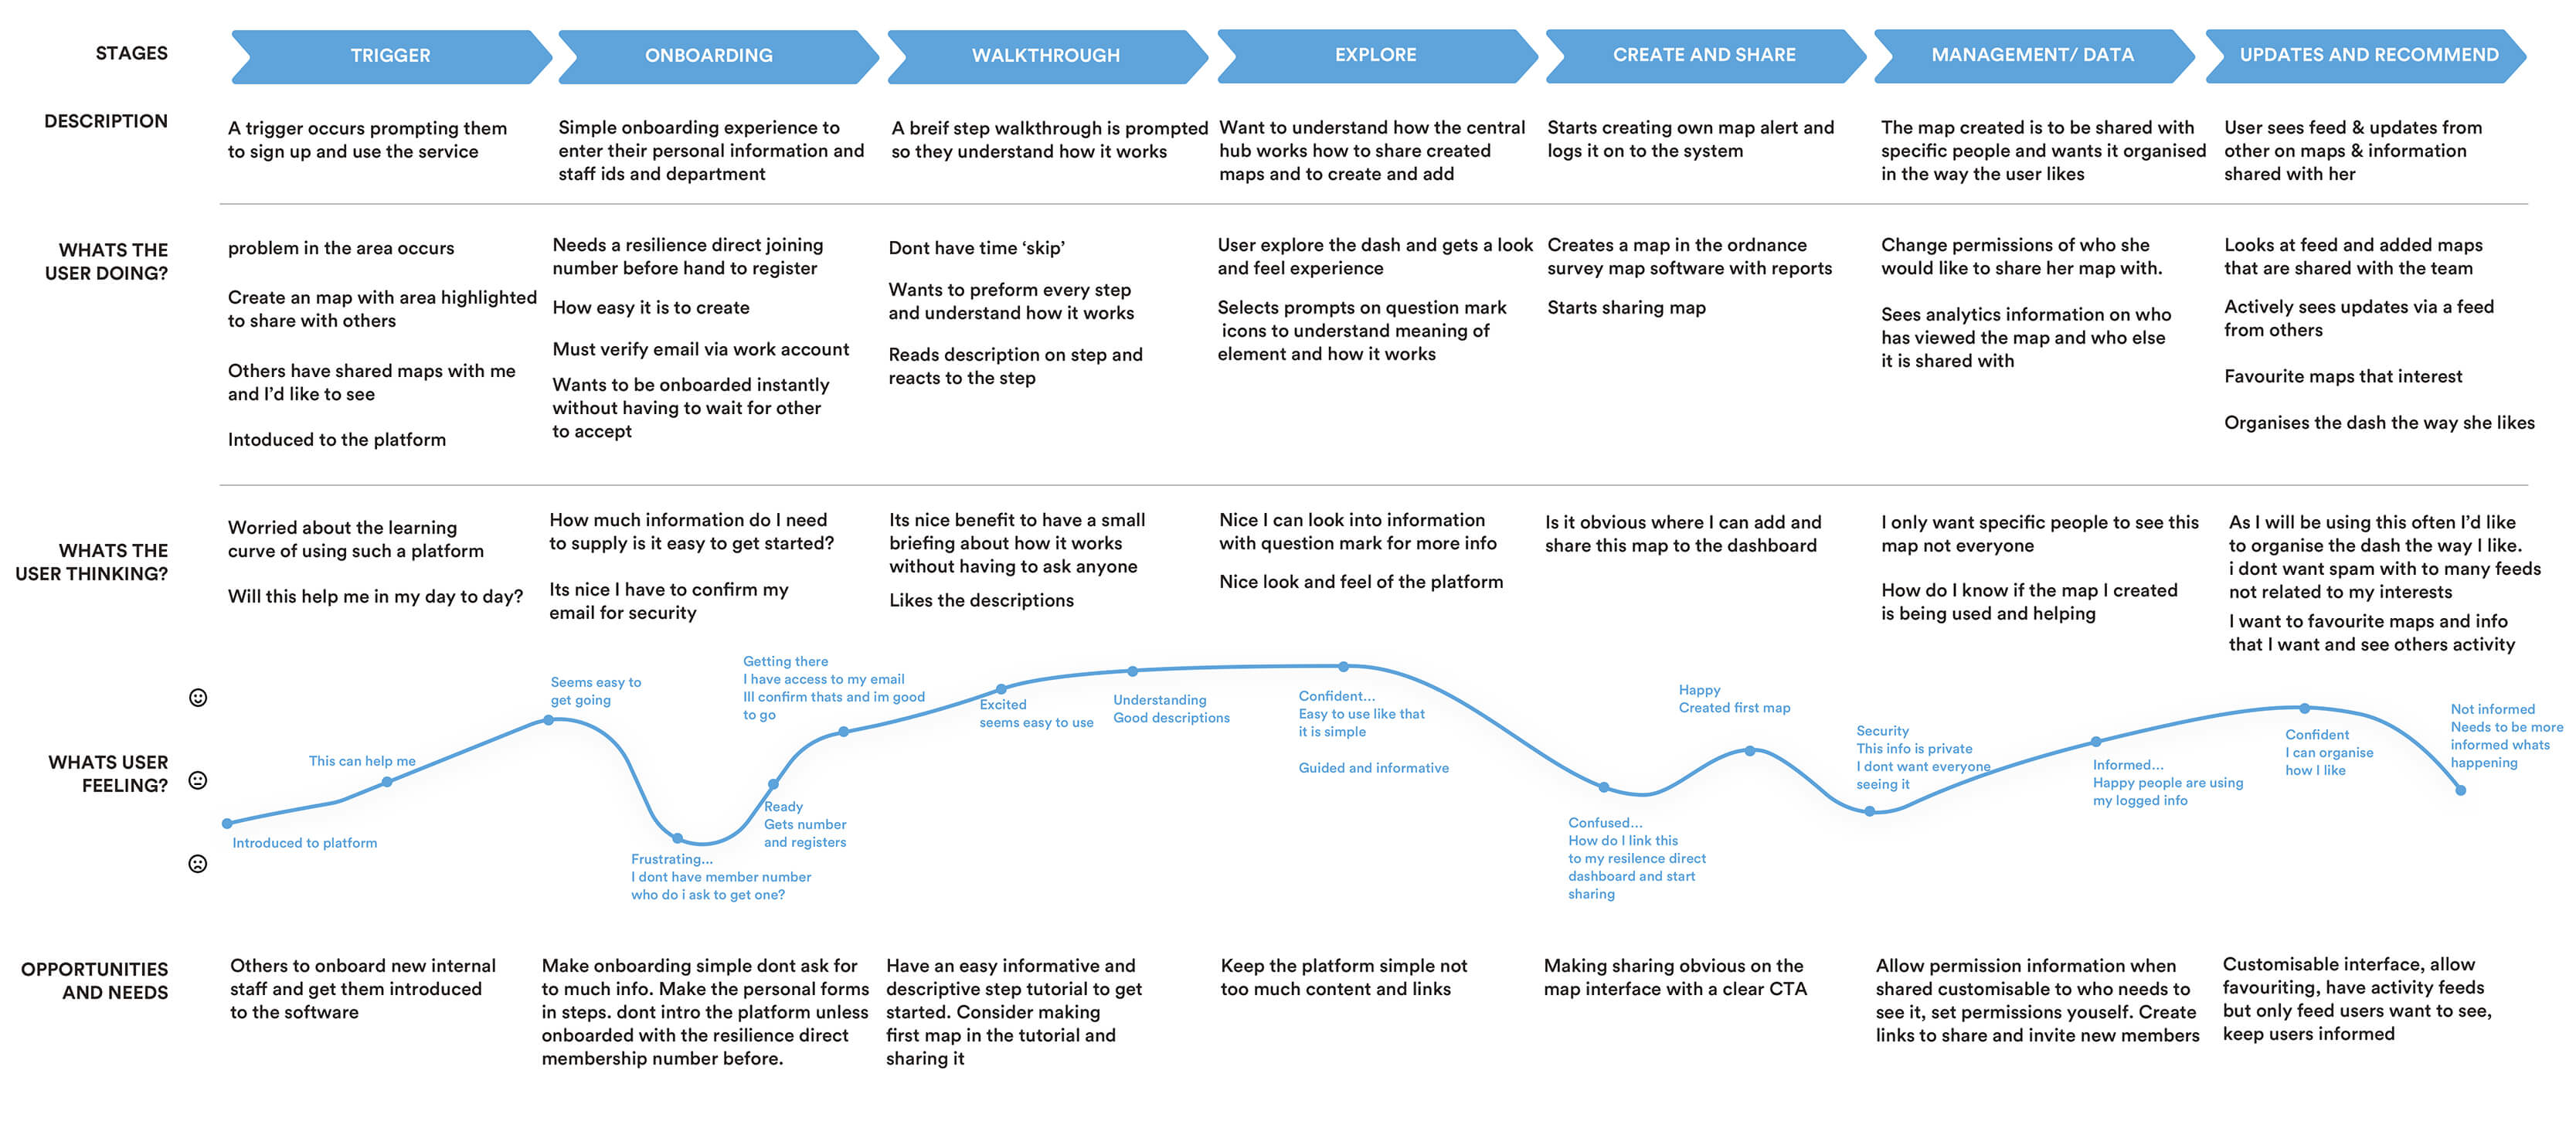
Understanding The Journey
Visually understanding the painponts & opportunities in a typical users journey, to get clarity on where I should focus on to improve the usability.
Workshops, Scope & User Stories
It was important to involve everyone in the Internal team via regular workshops & make decisions as one before presenting
Sketching & planning
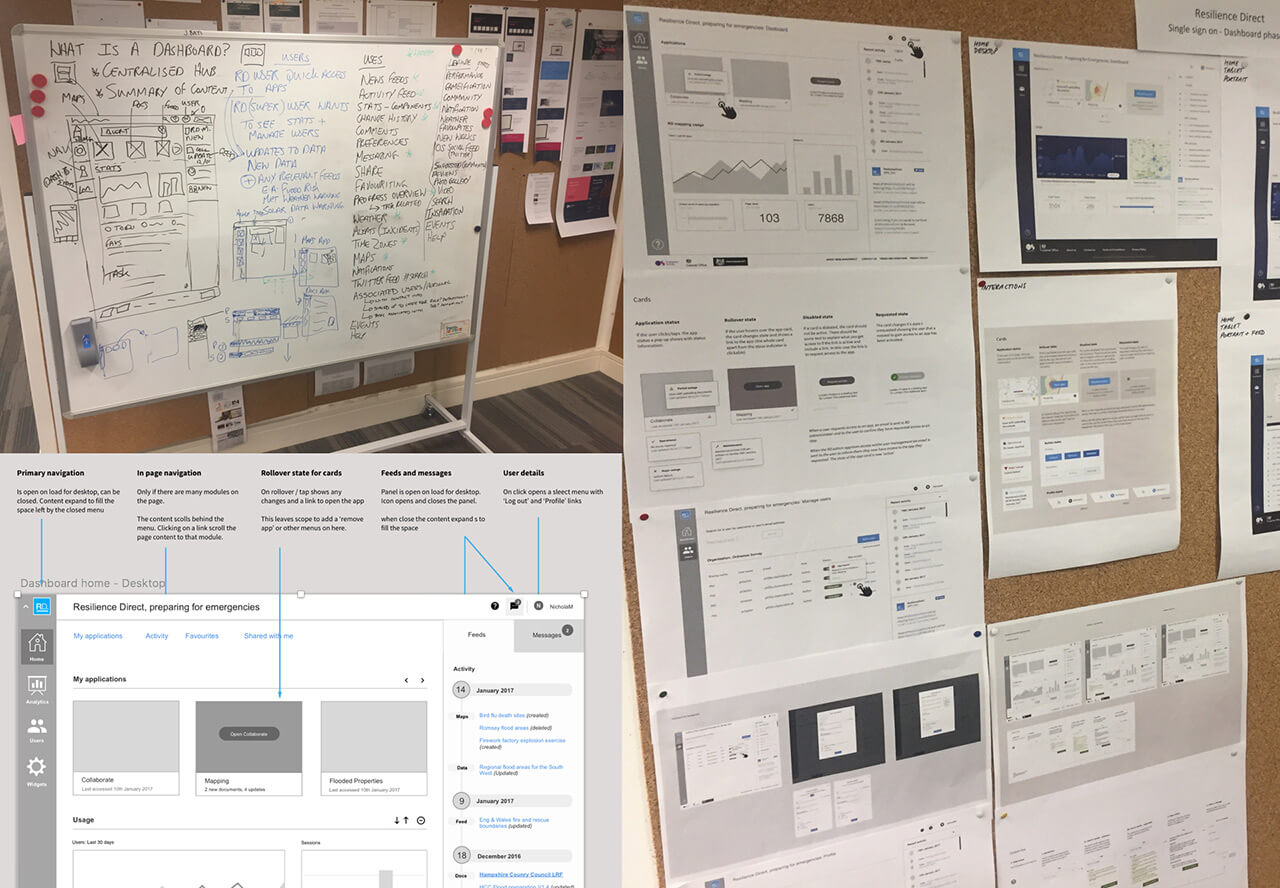
Wireframing, Business & User Needs
Bringing the vision to life before showing the wireframe solution to stakeholders. Making sure that the business & users' requirements have been addressed so what is shown does not add confusion.
Iteration, Iteration
Before the wireframes were approved there was iteration in the wireframes to fit futher business requirements.
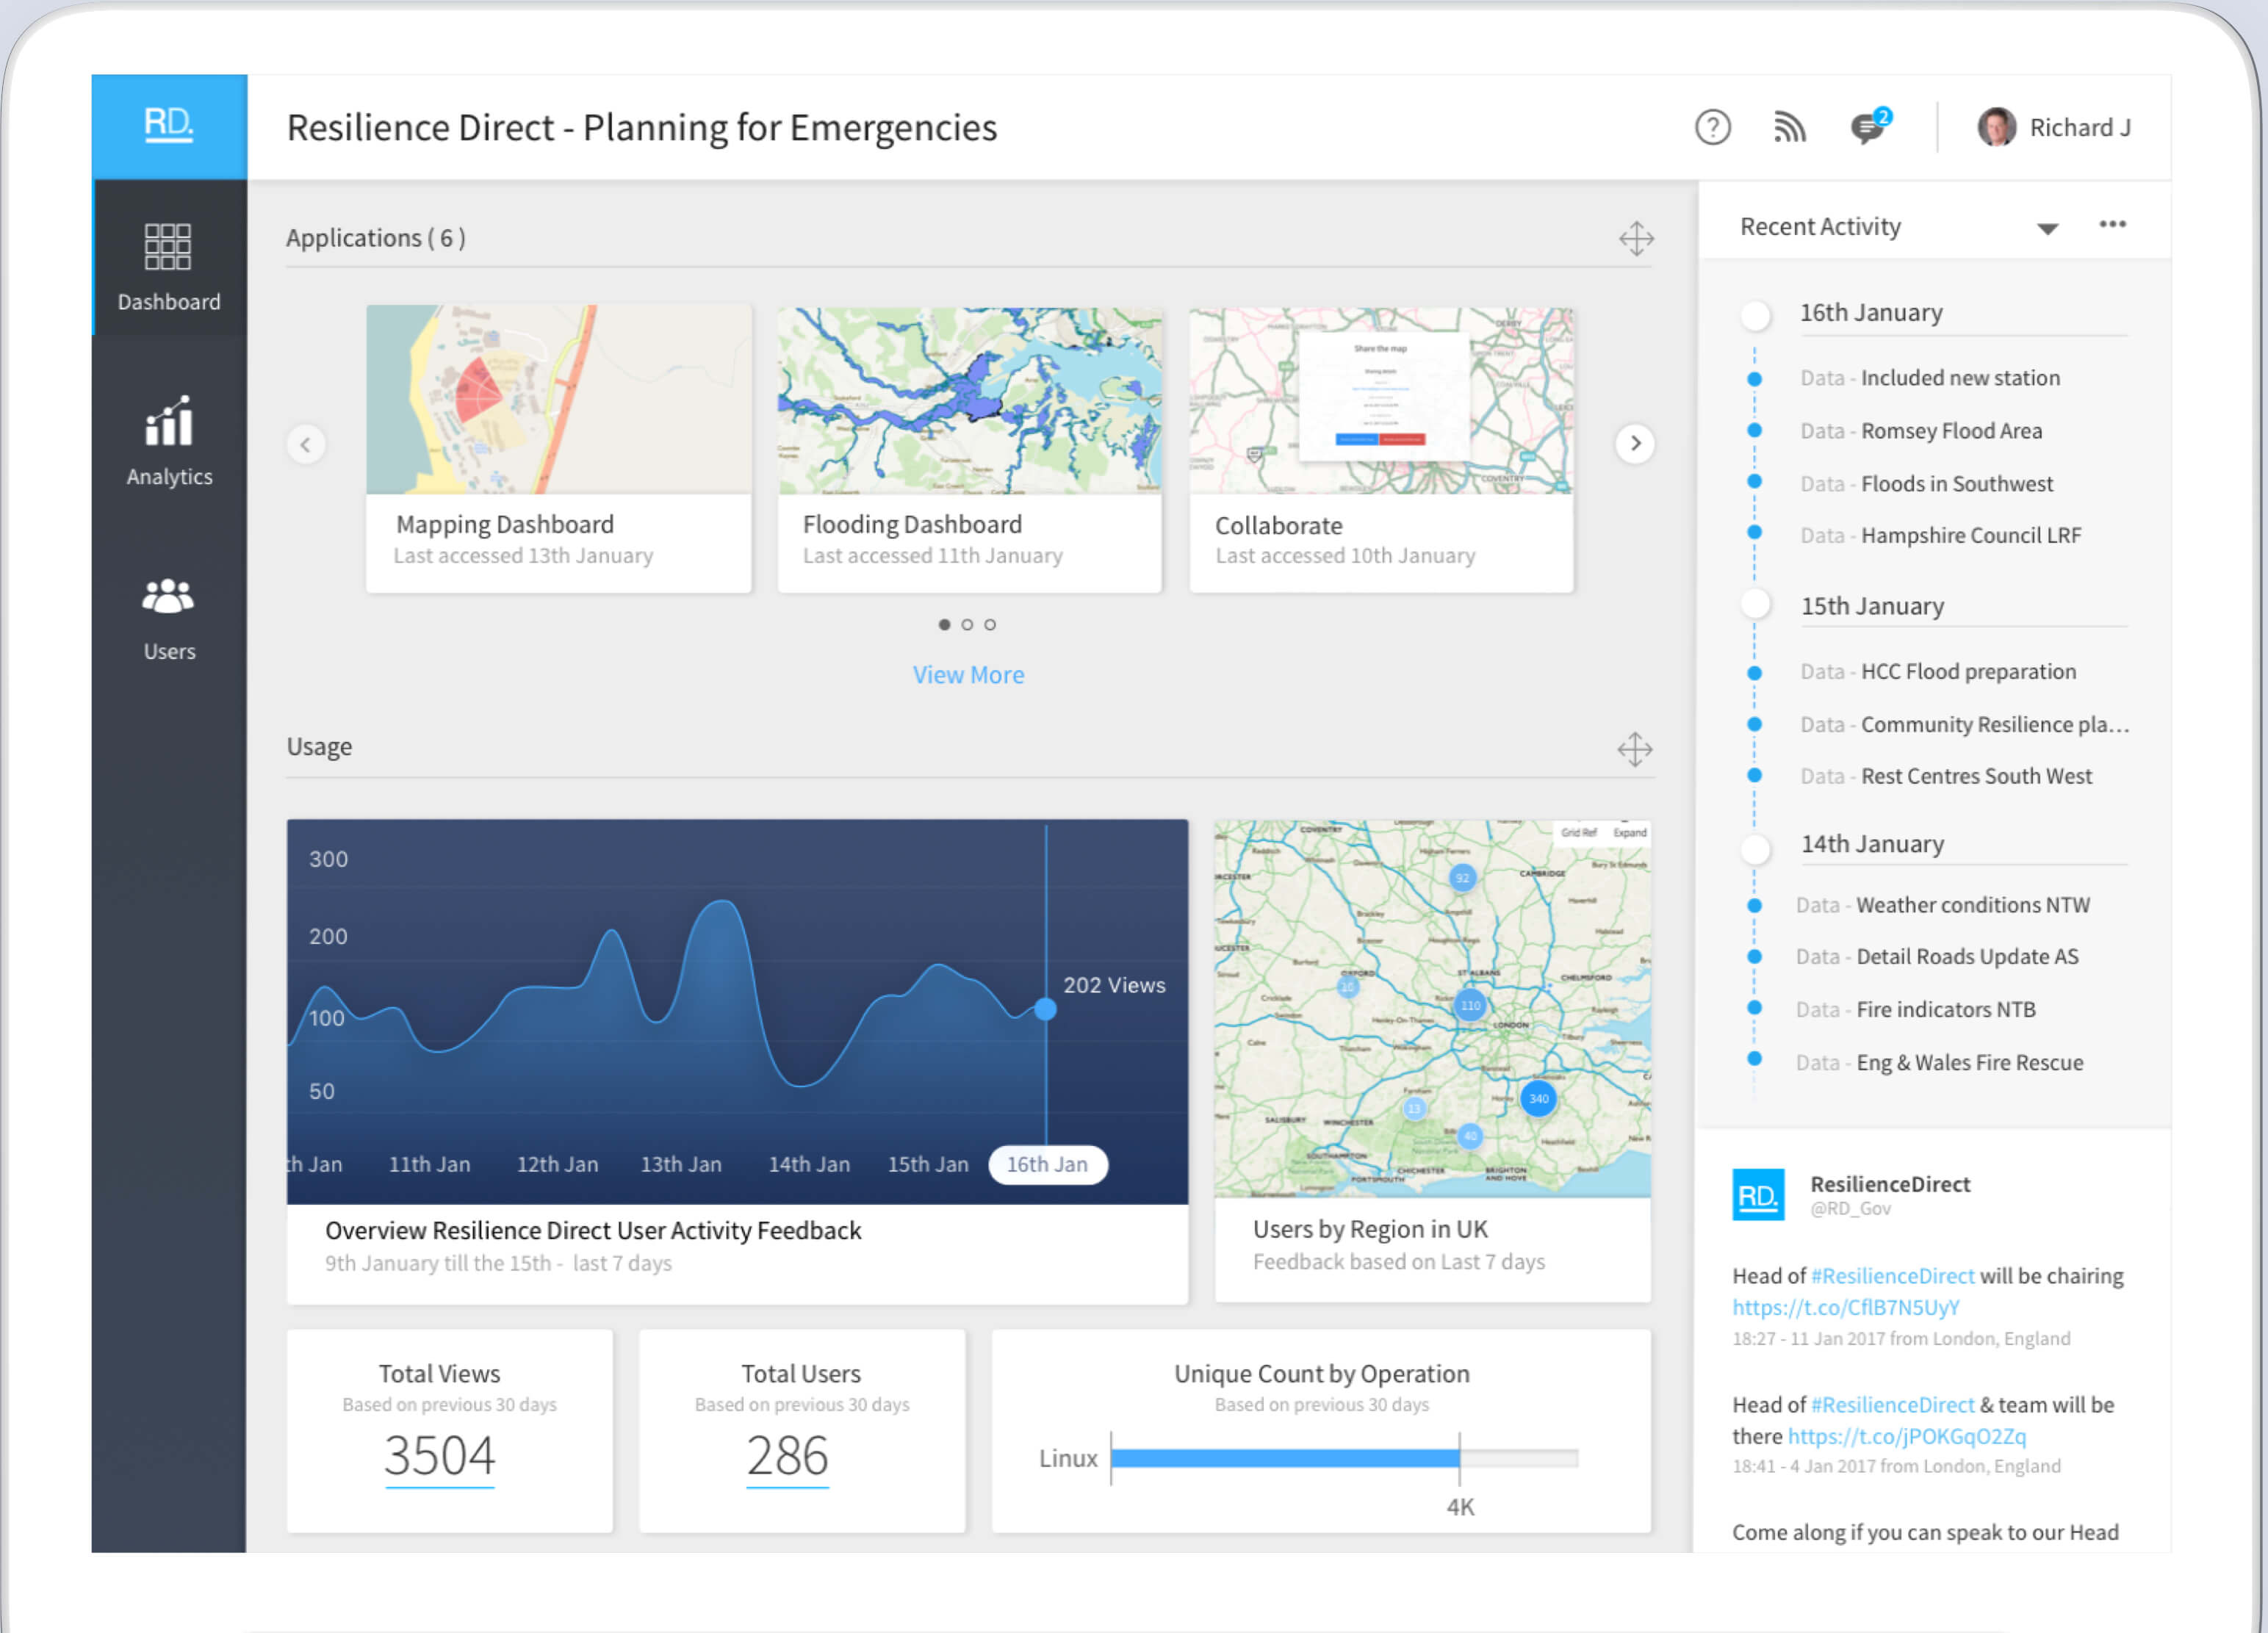
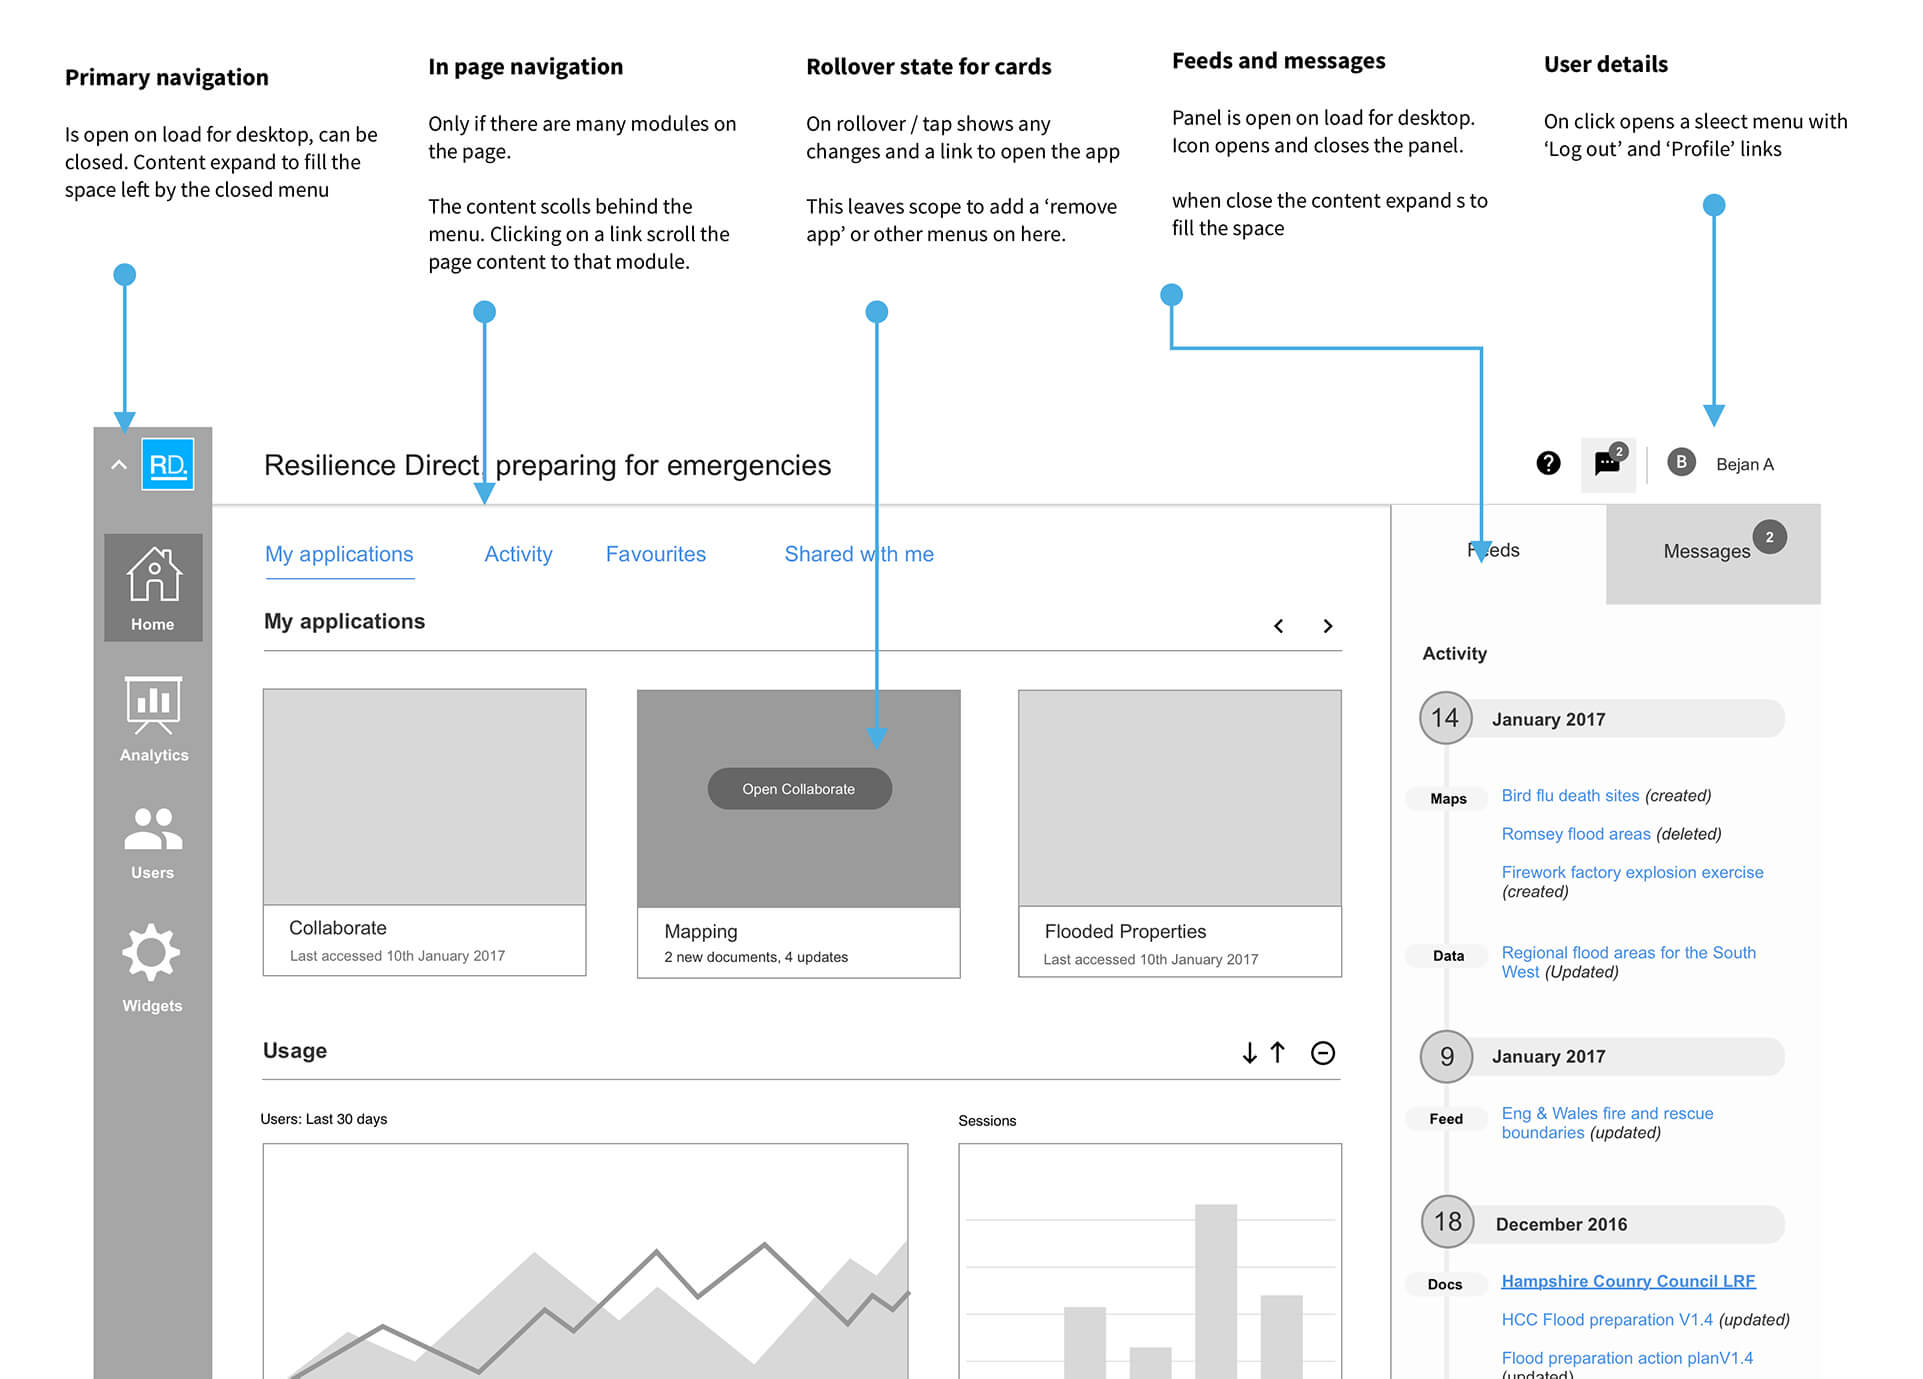
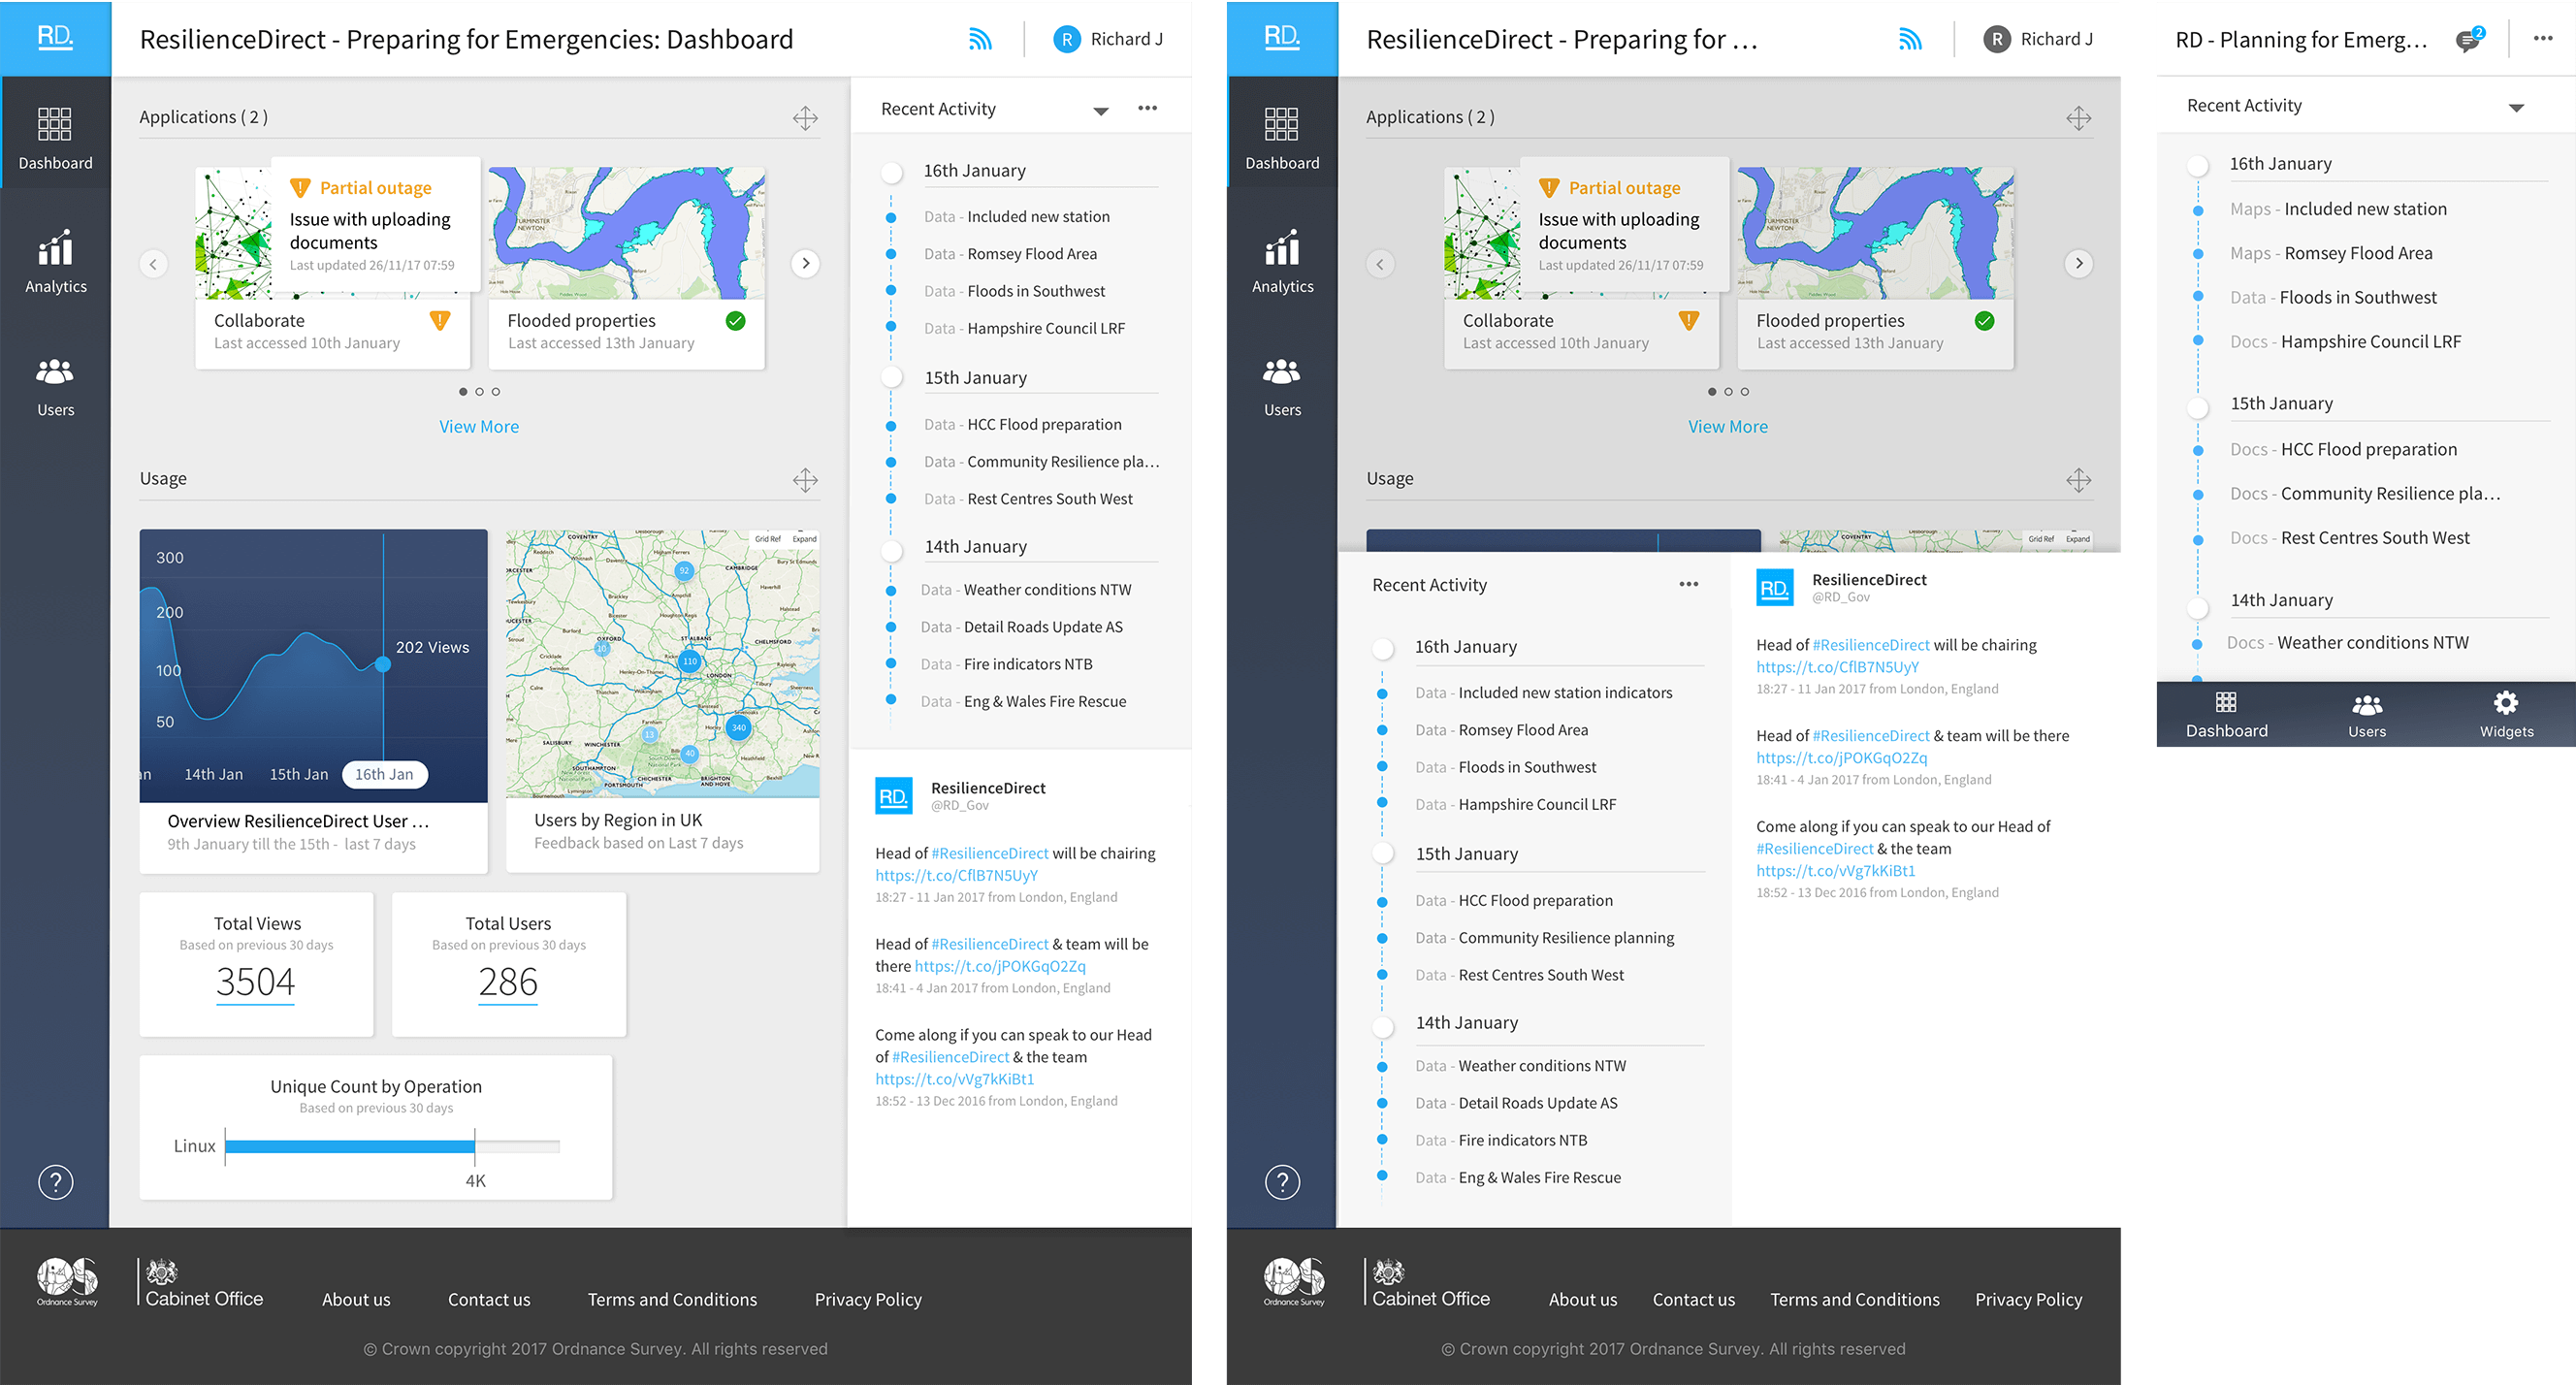
Main Dashboard Activity
Users are greeted with access to the various OS mapping apps, activity feeds & analytics. They have ability to arrange main dash screen how they like.
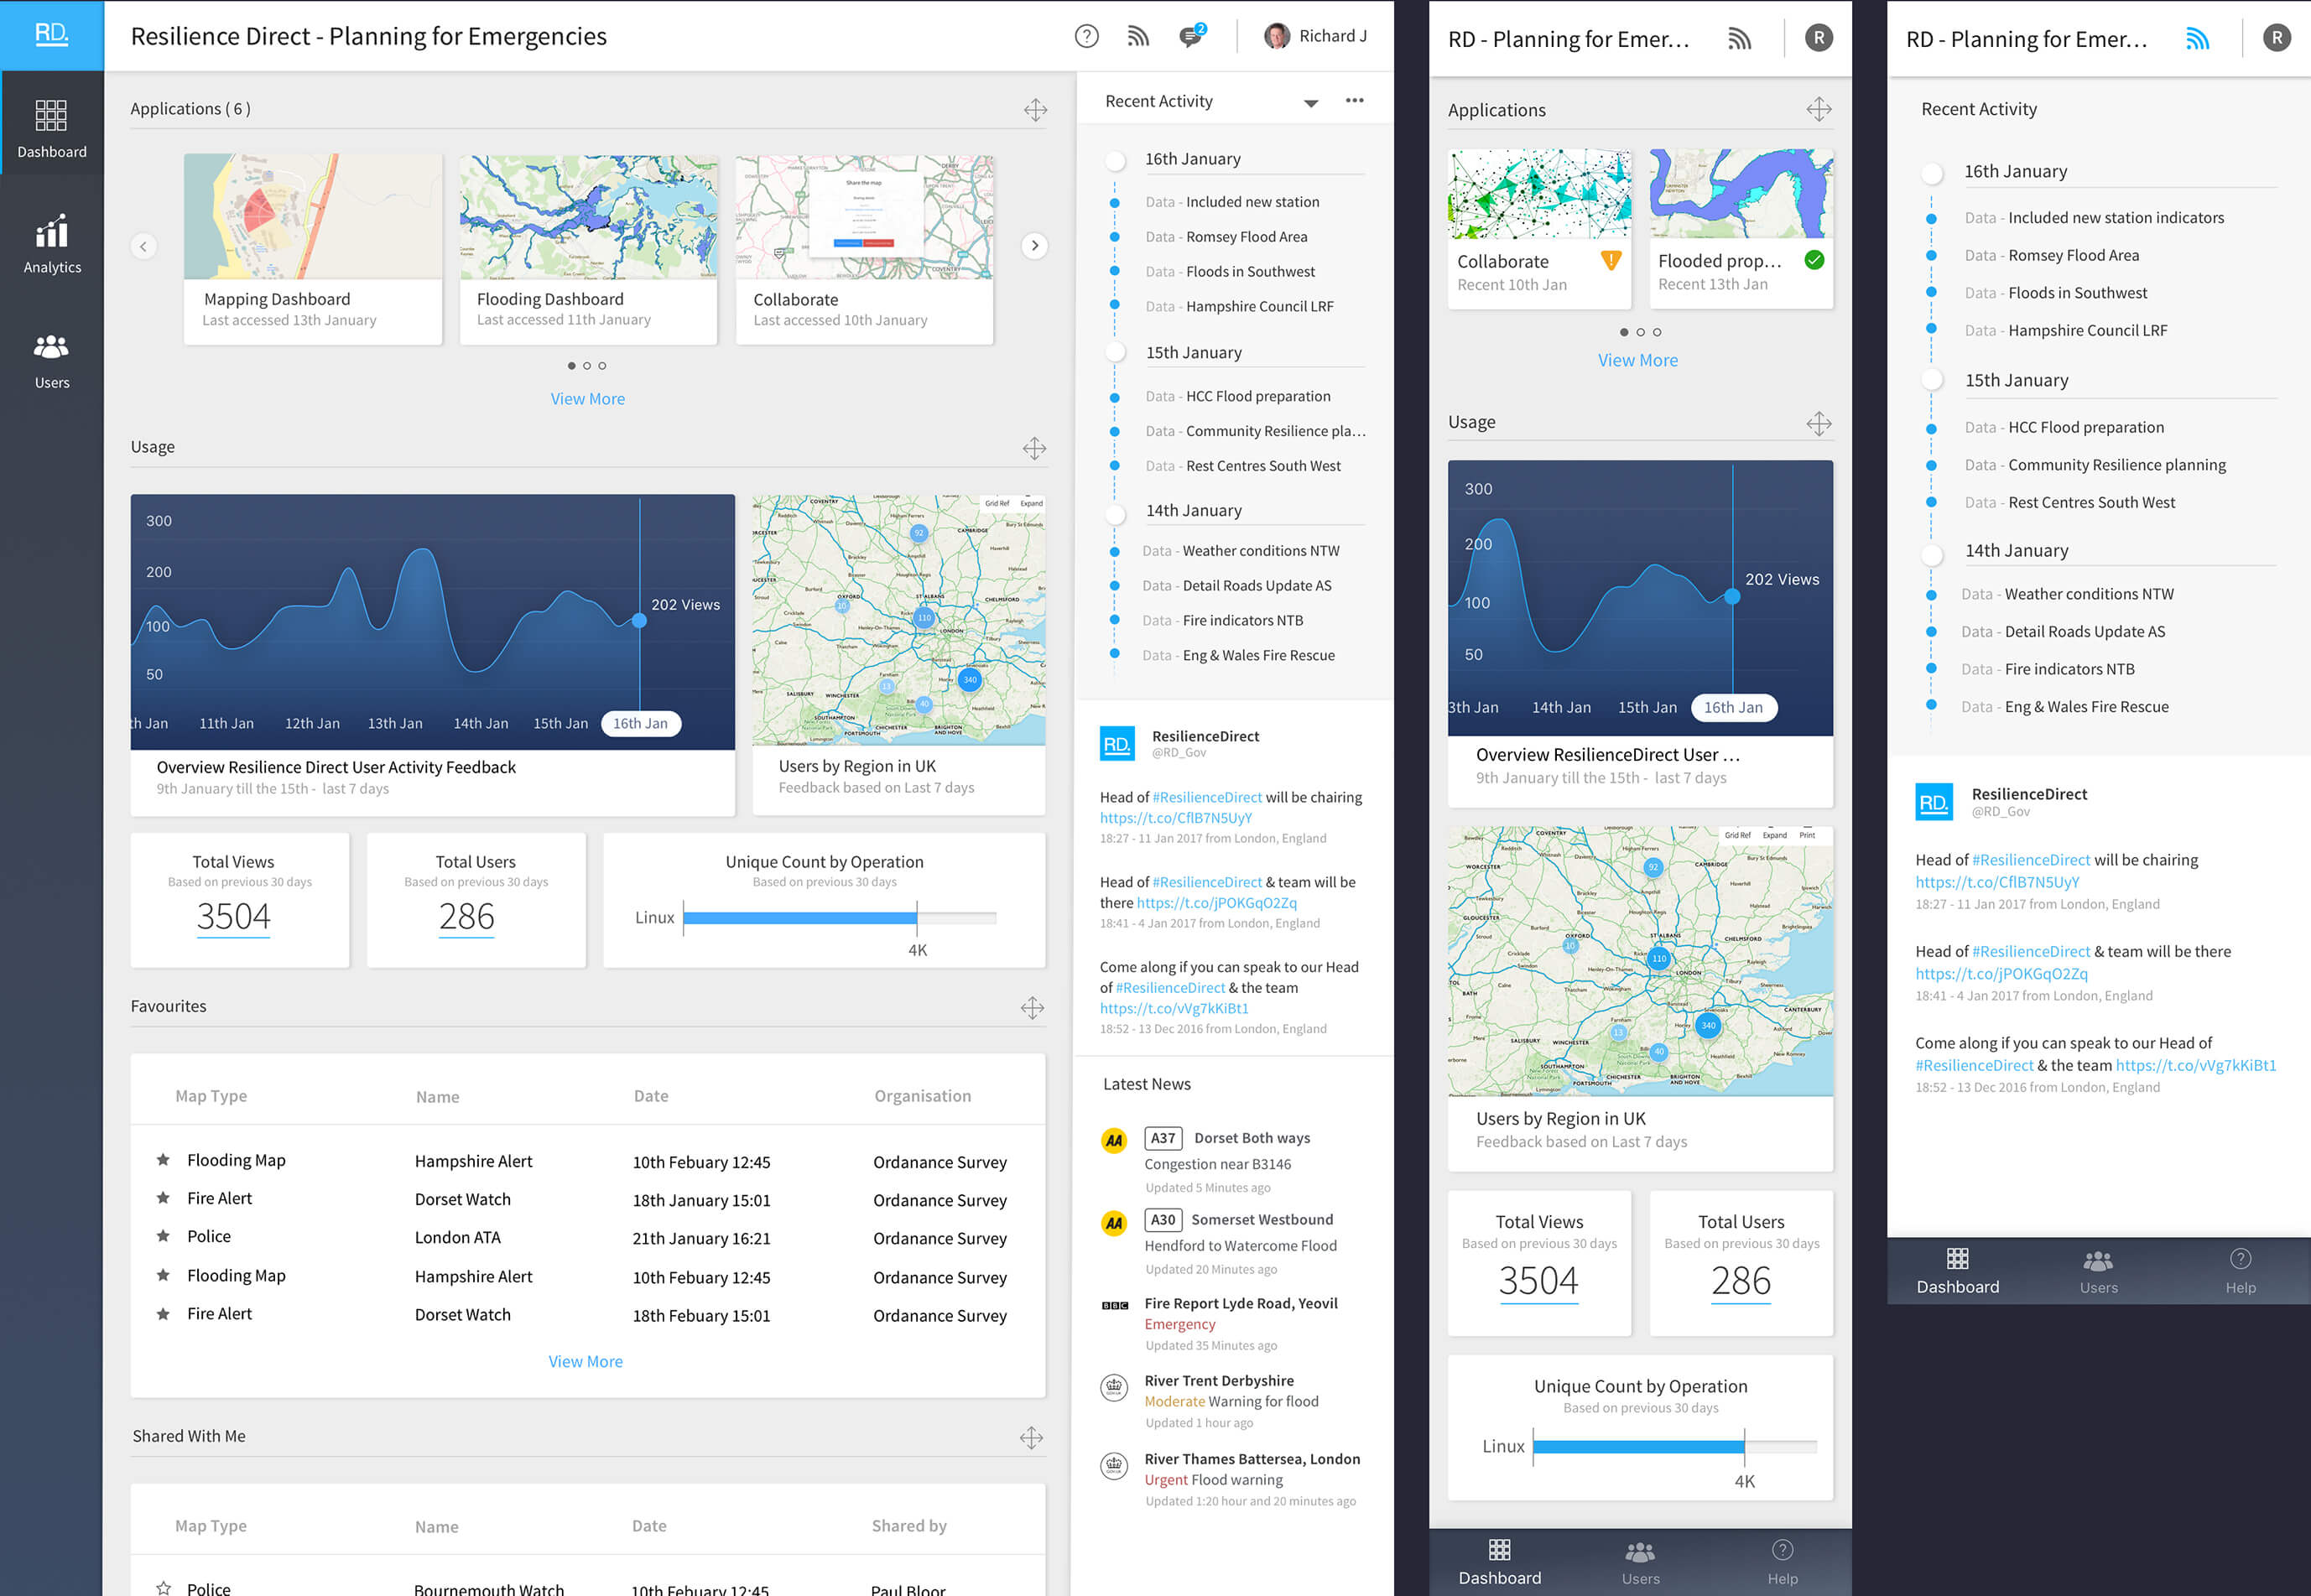
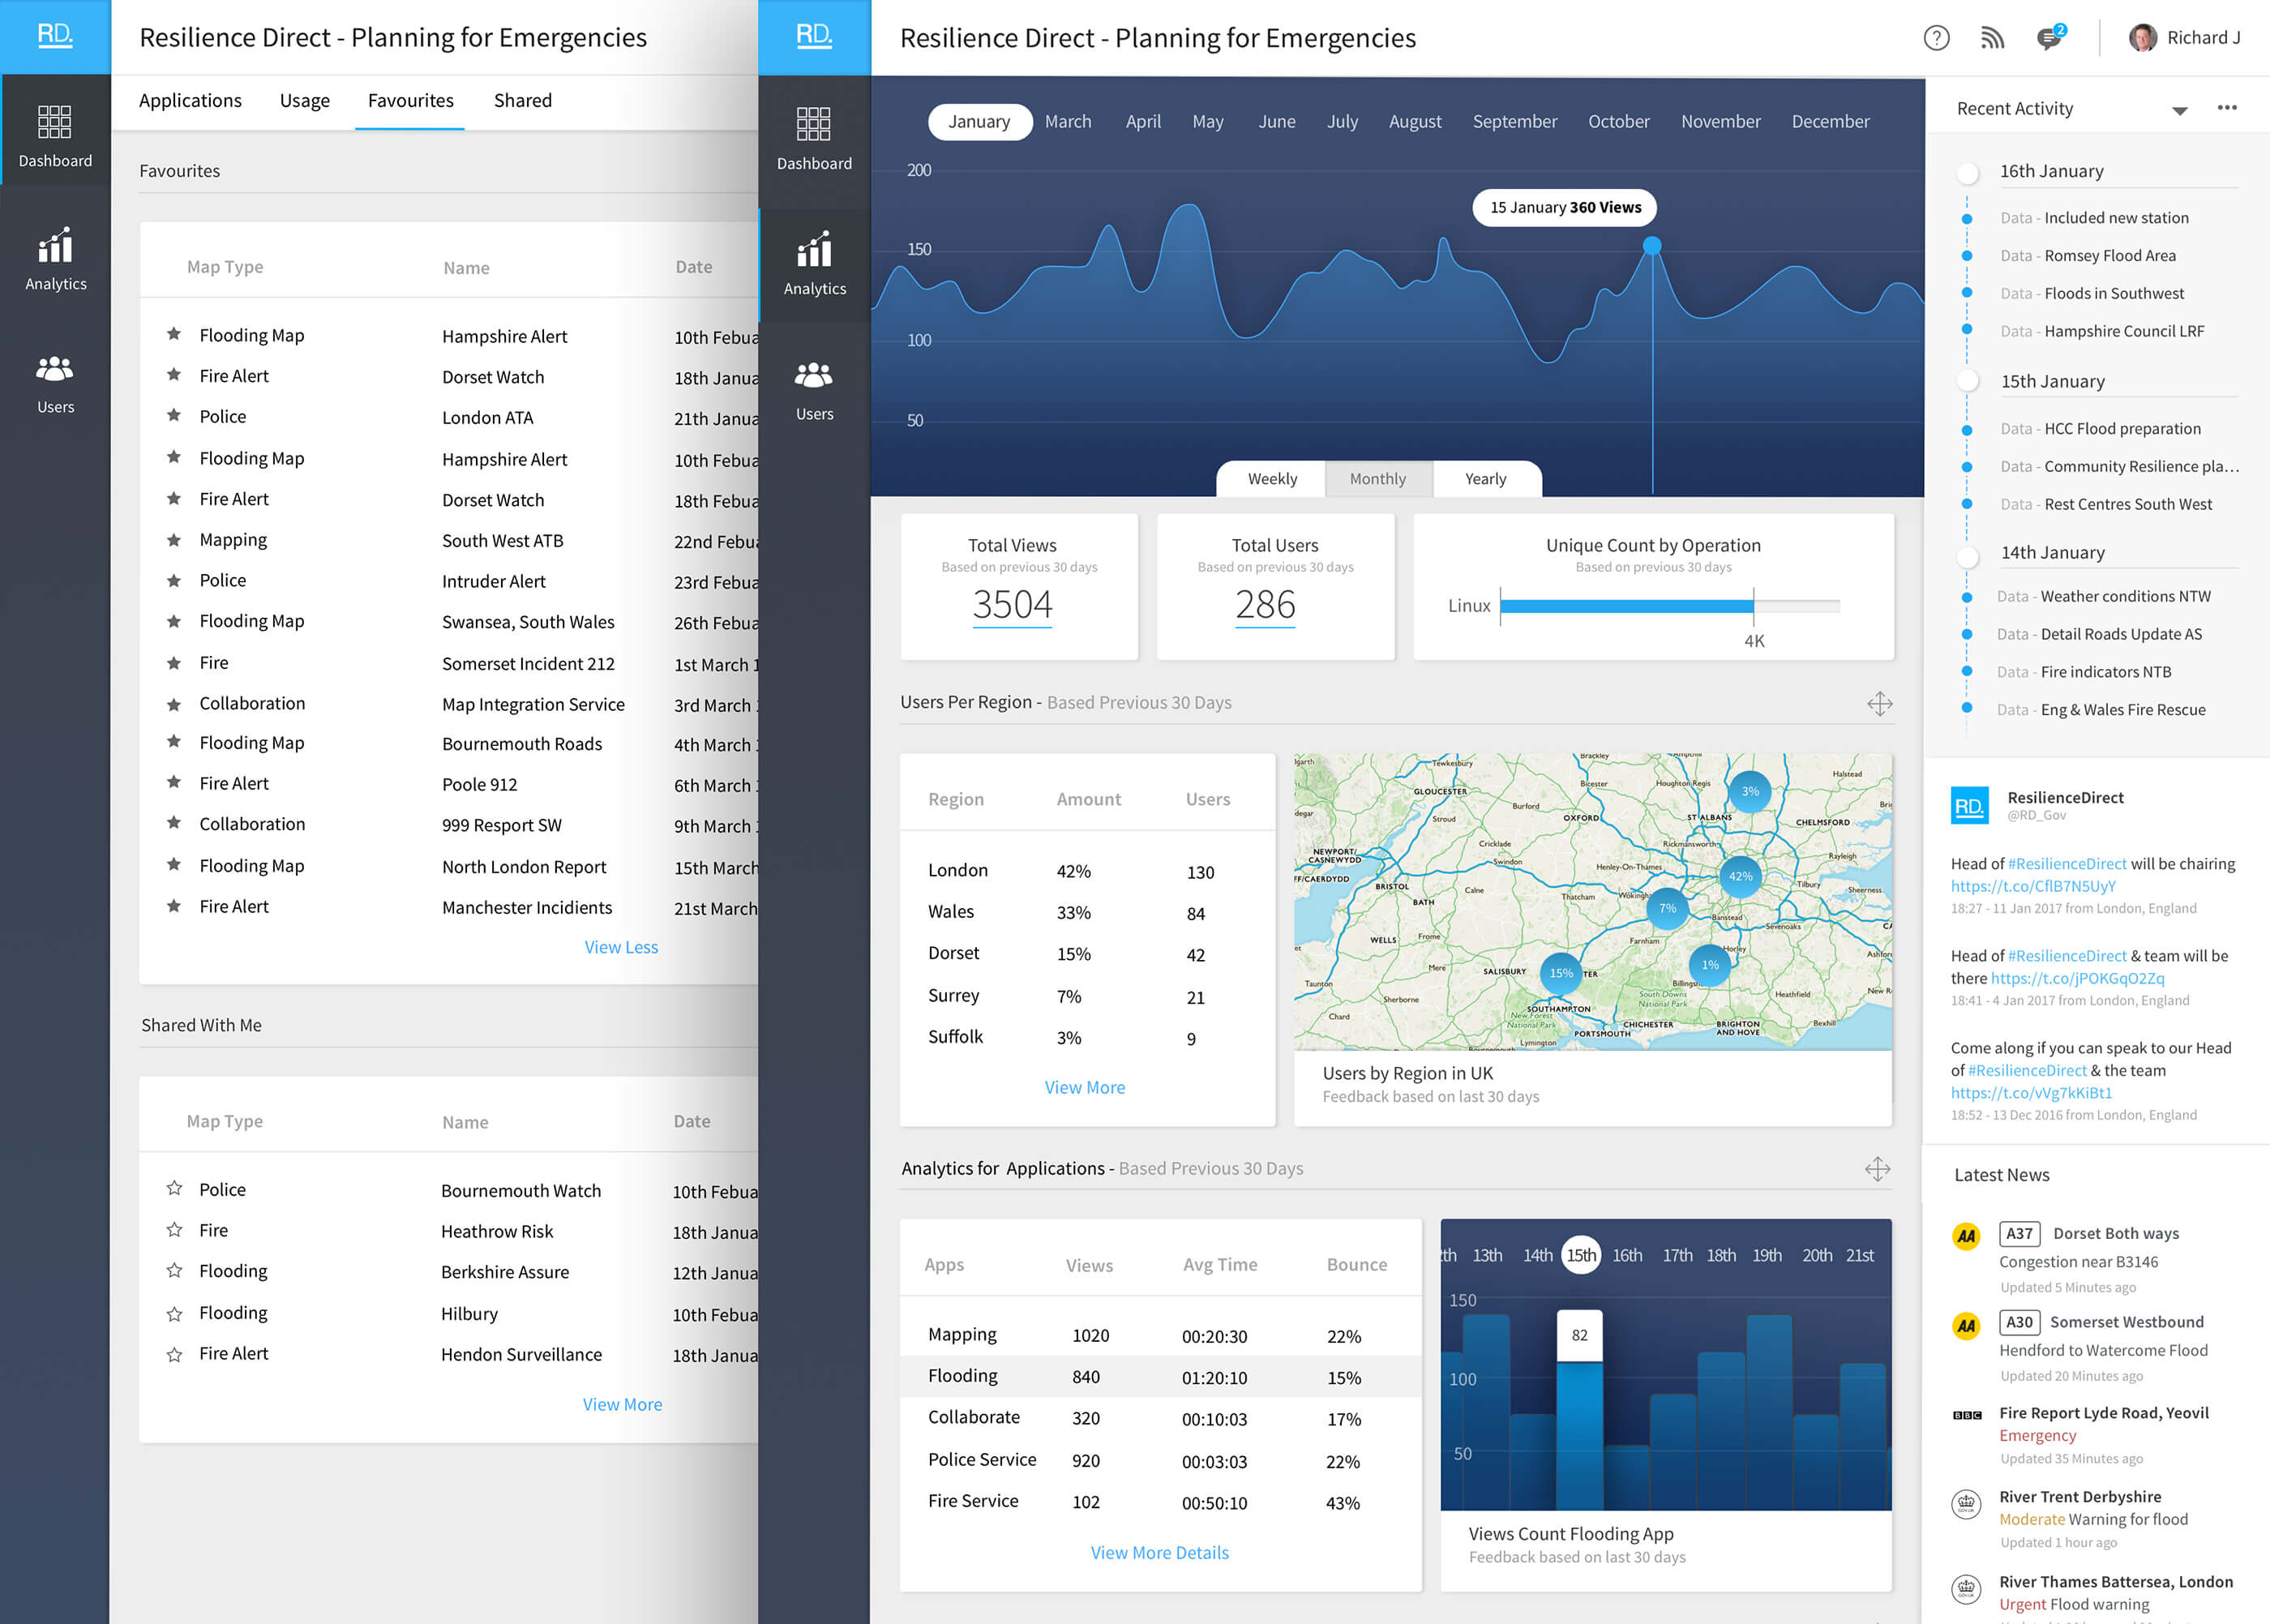
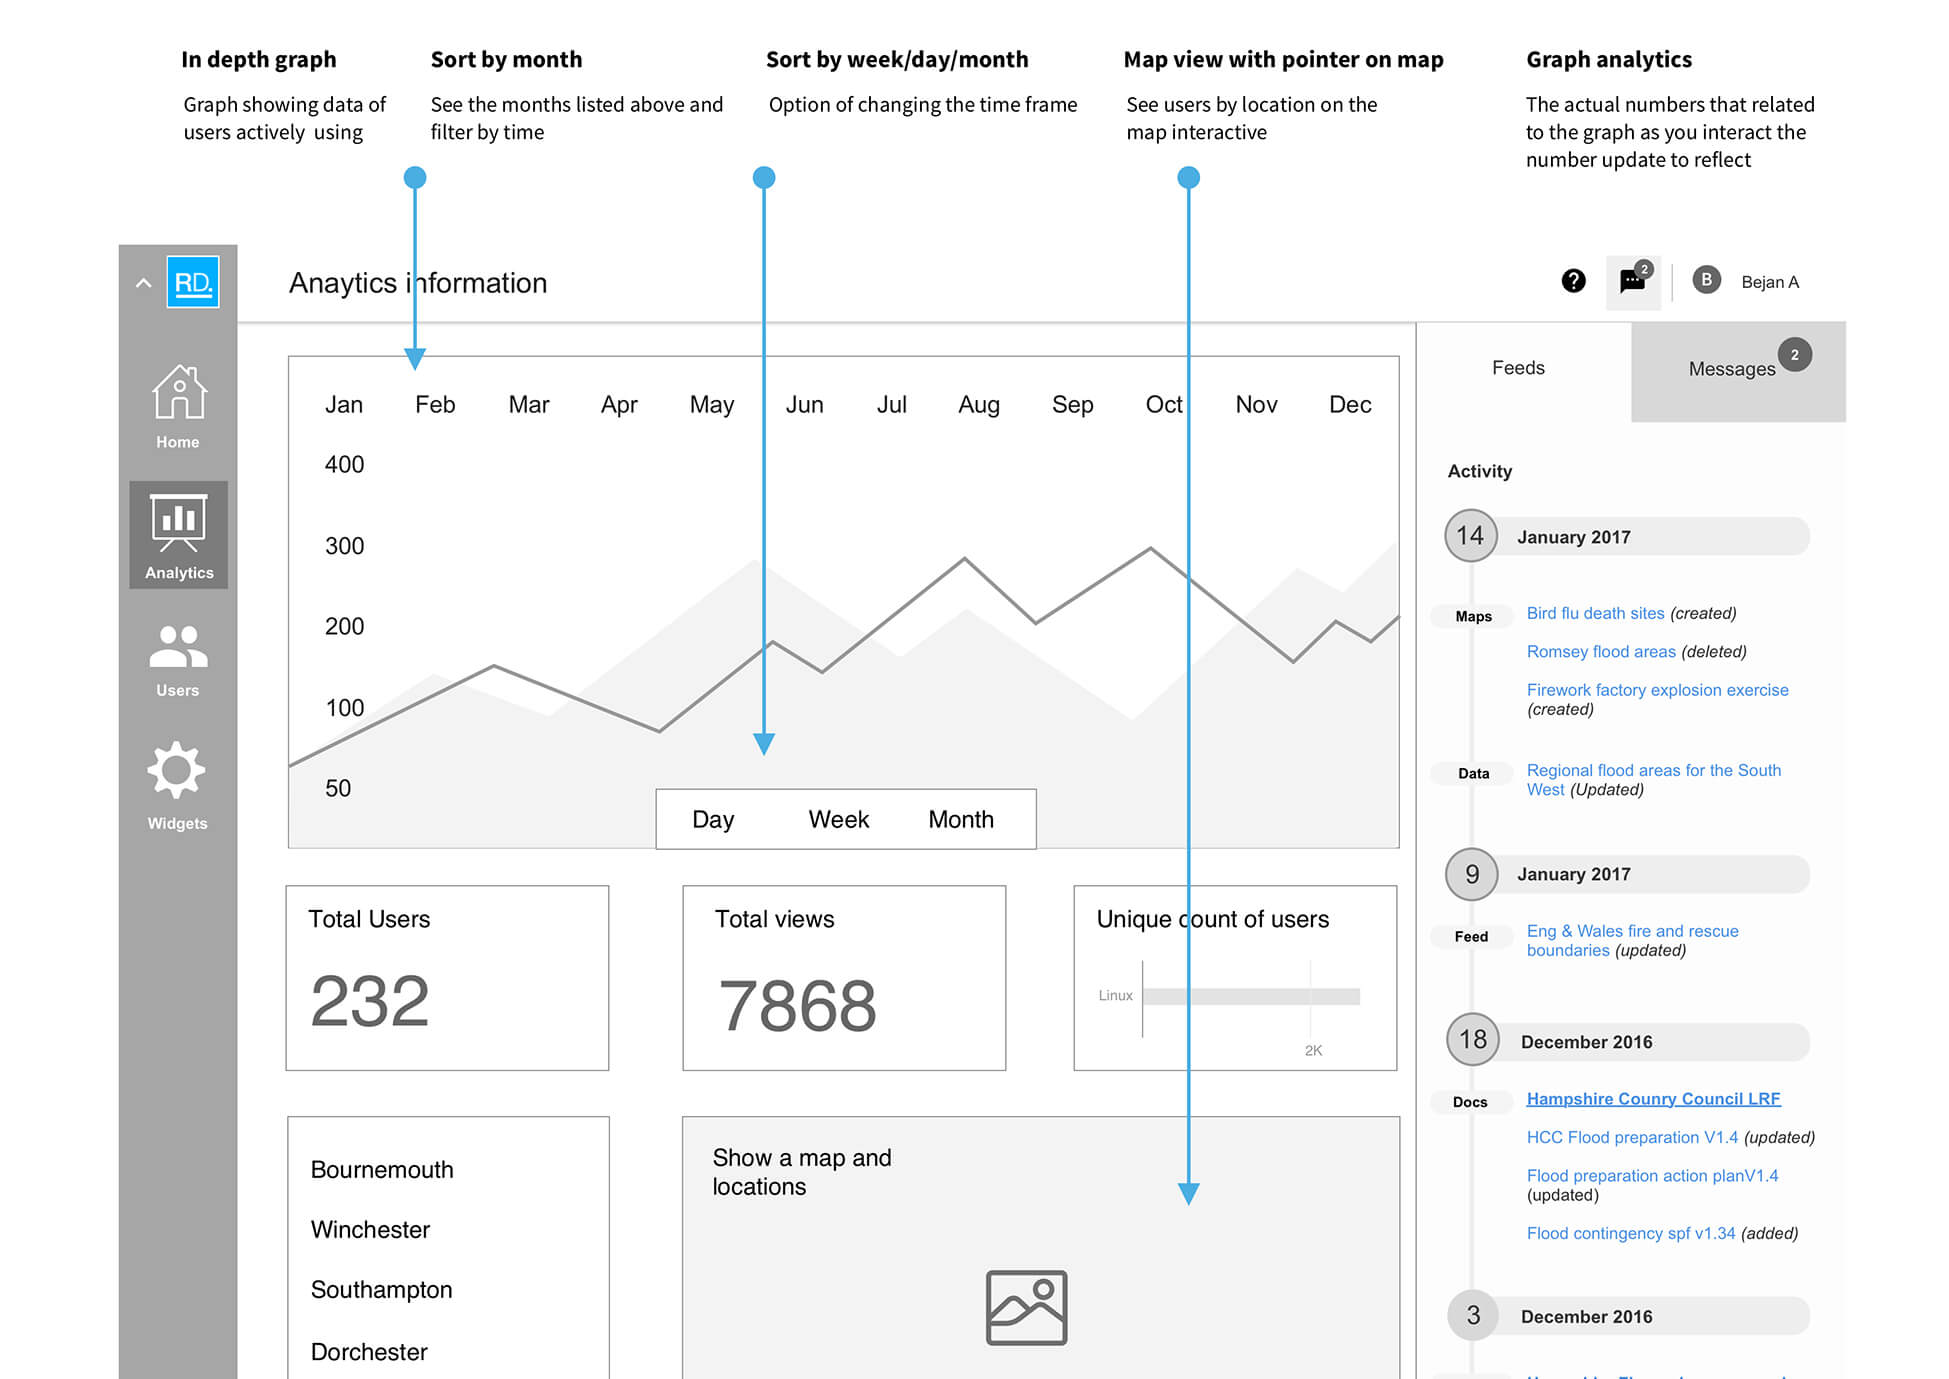
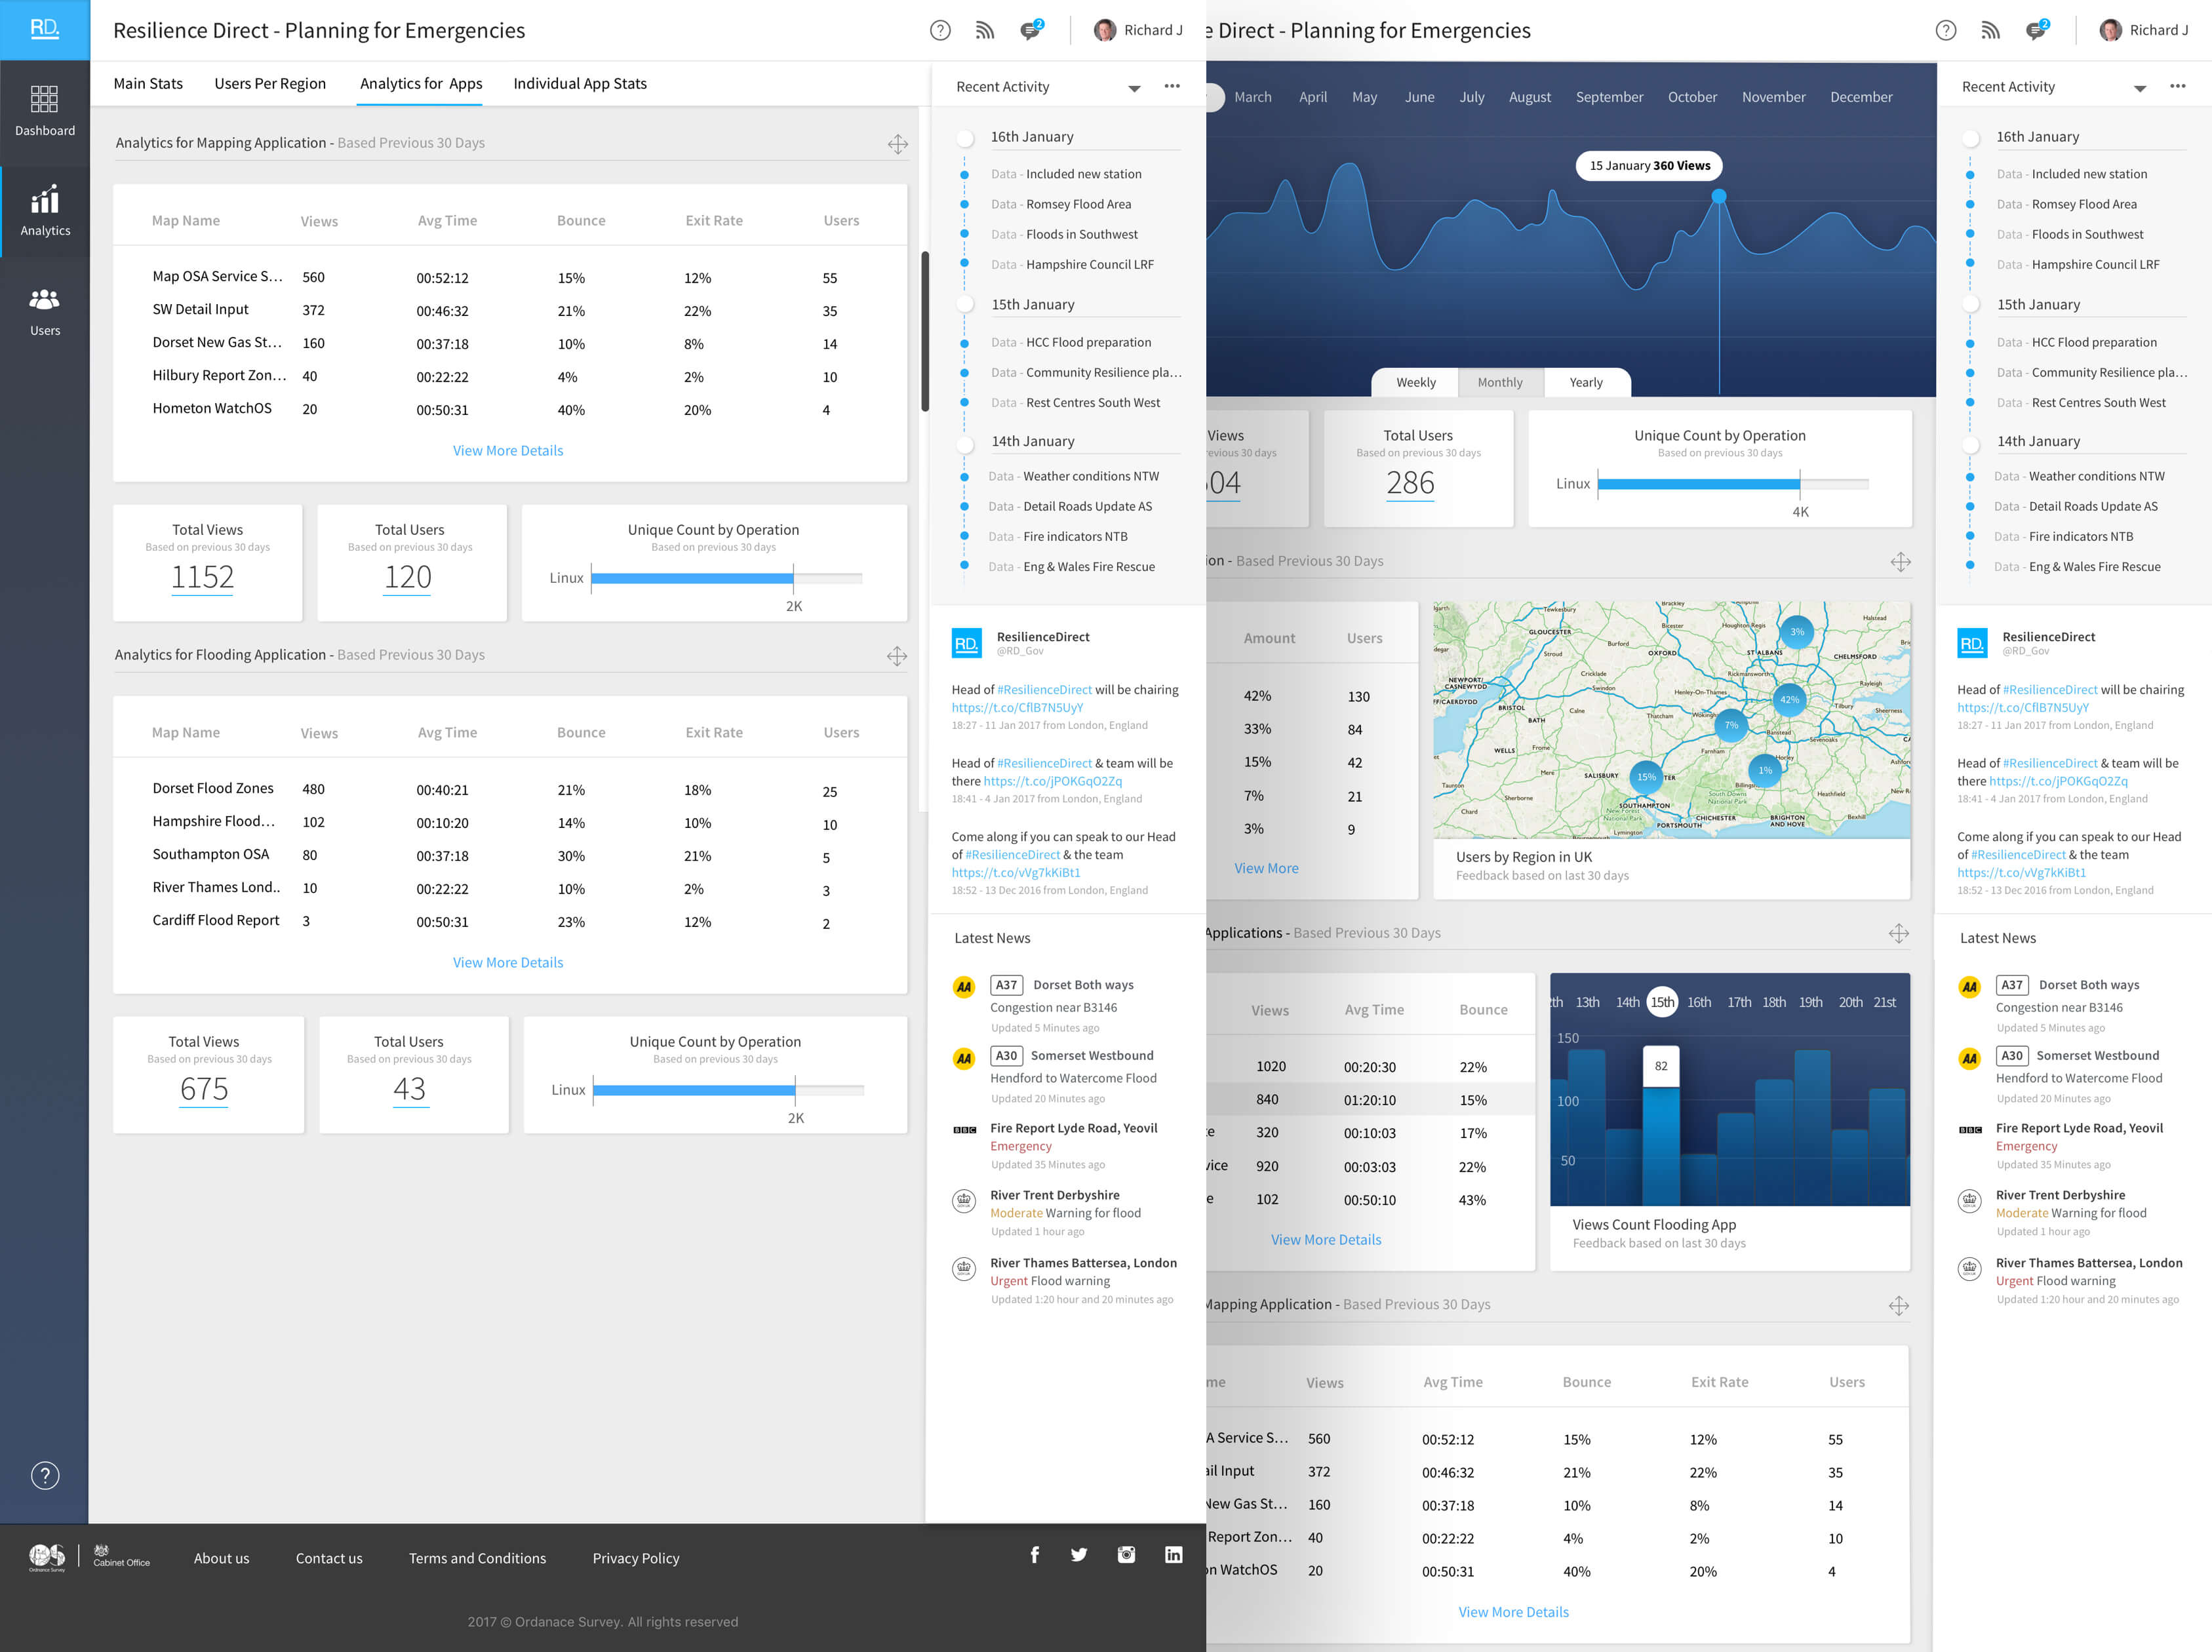
Analytics Data Visualisation
The analytics feature enabled clients to see information on users accessing the maps, when, the bounce rate, total users, views & drop off rates.
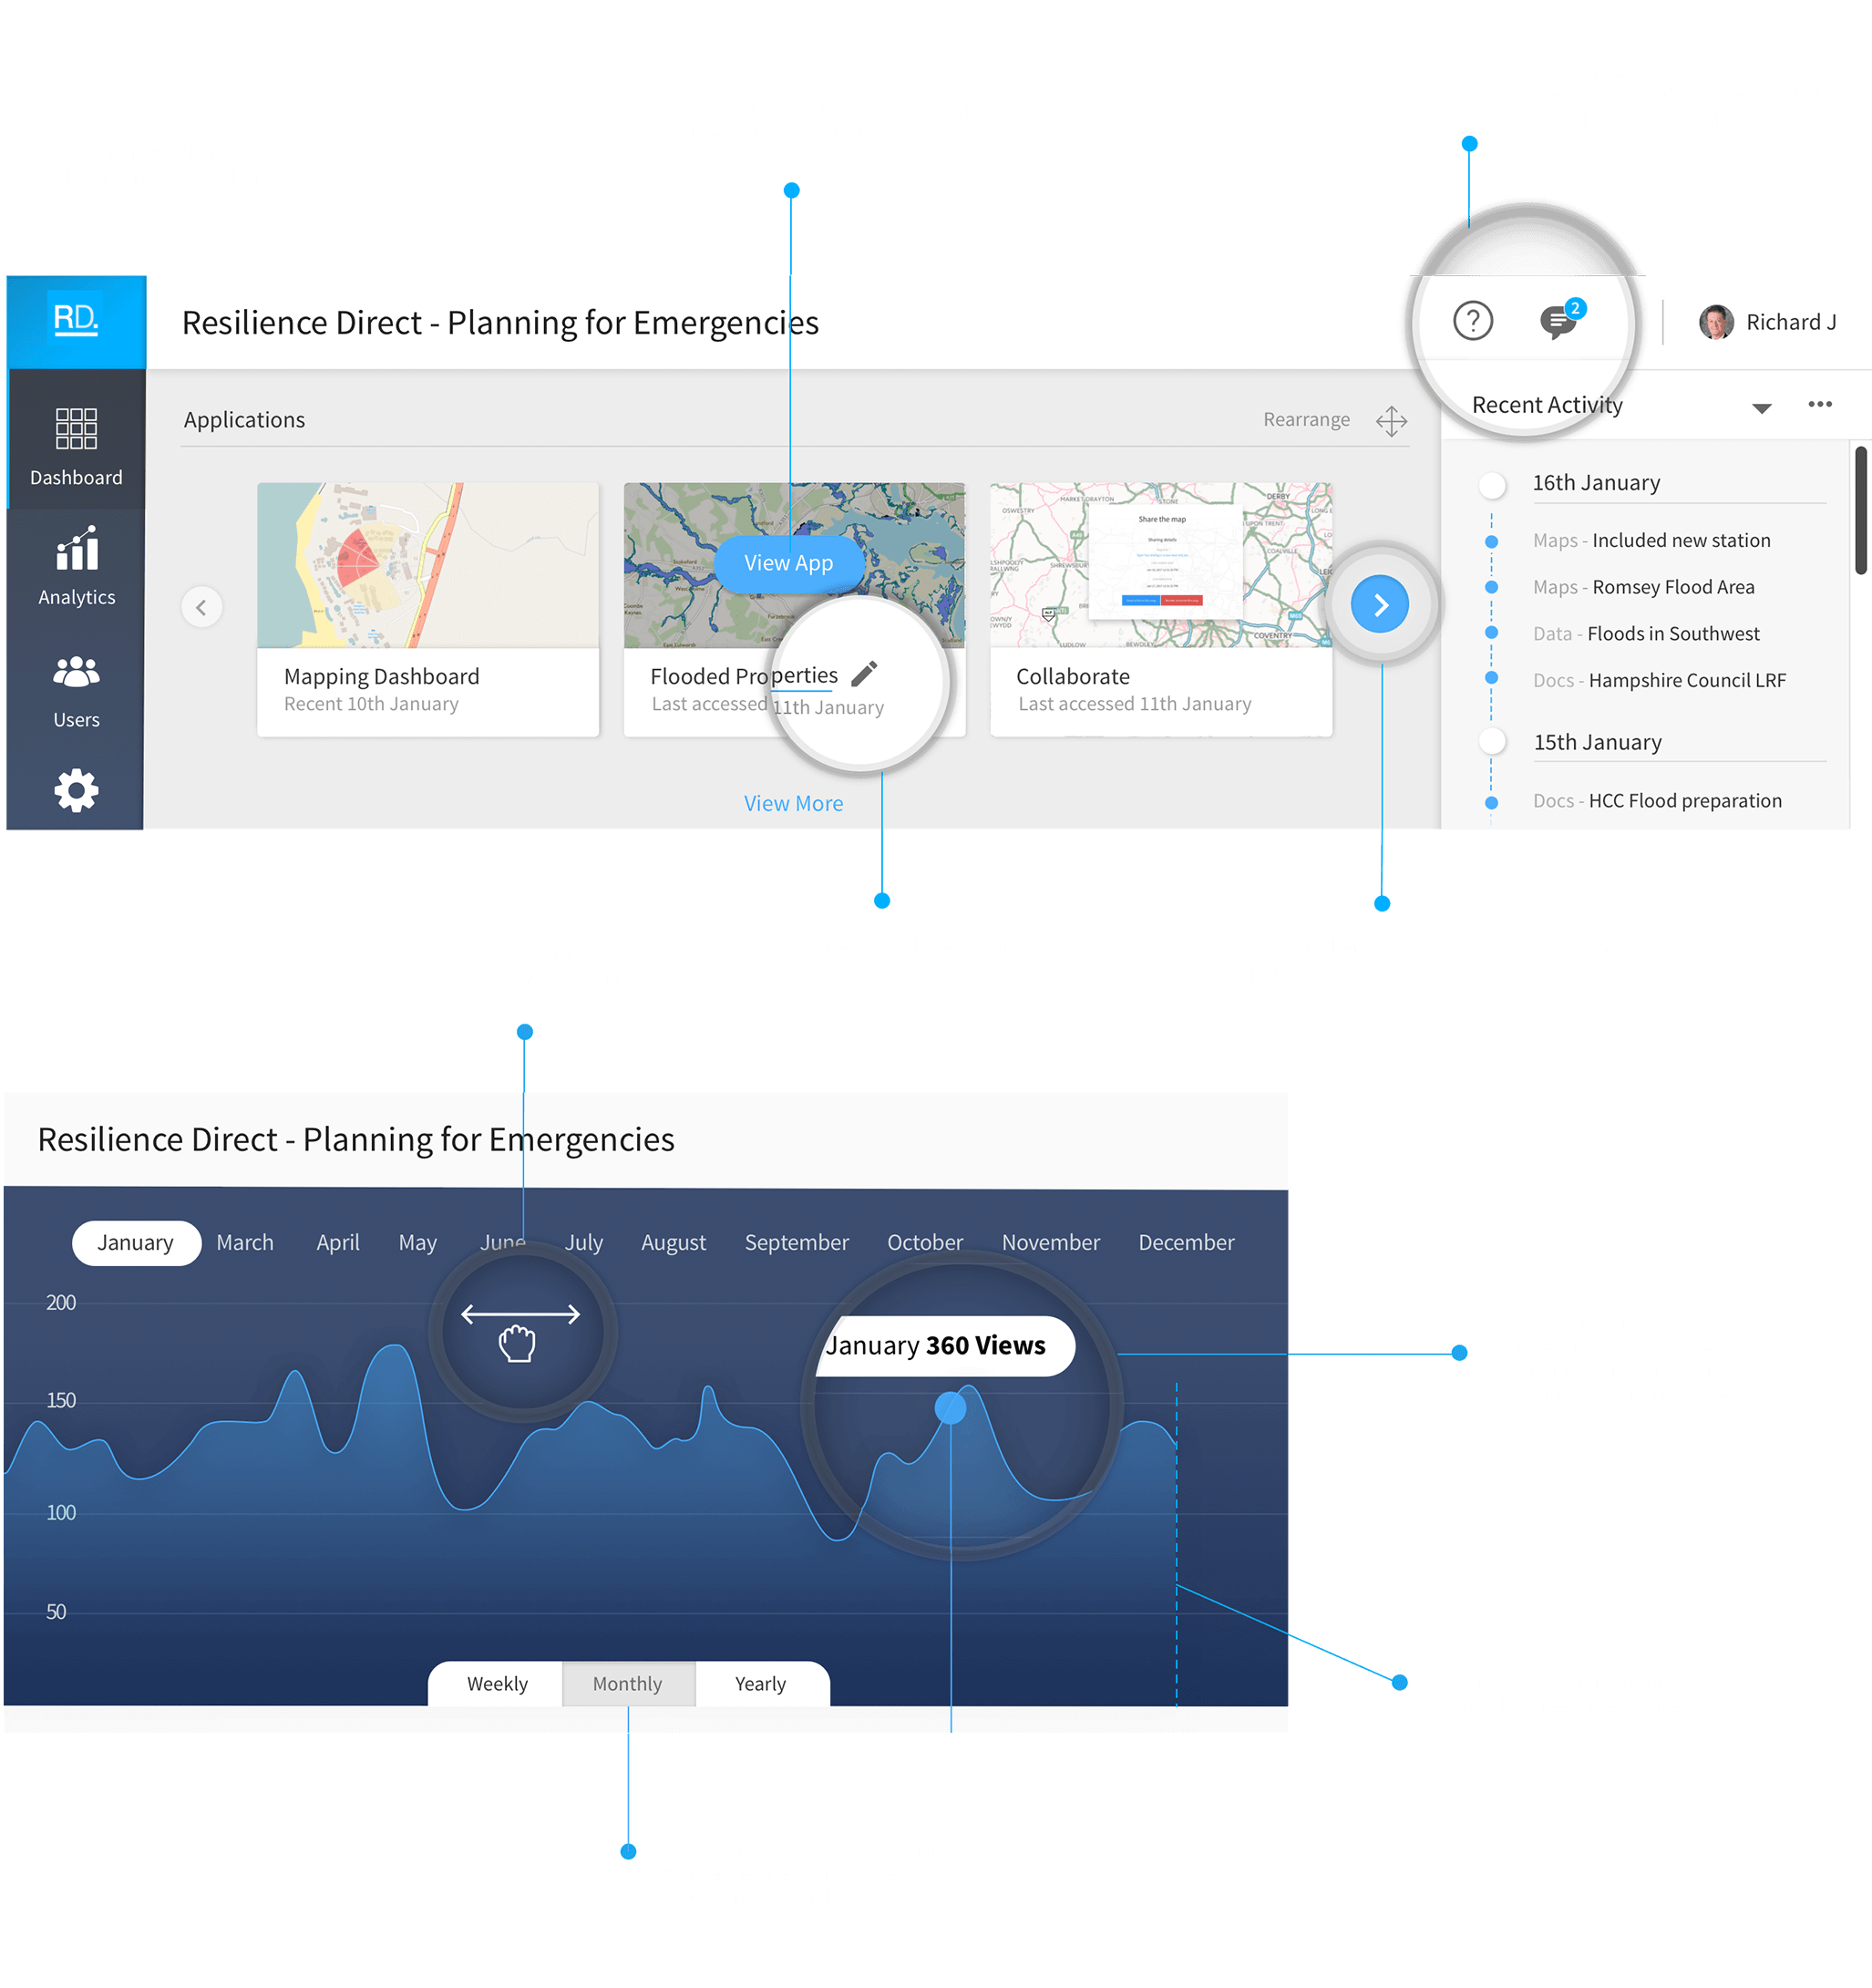
Planning The Functional Aspects
Highlighting how certain elements on the dashboard will function & work
User Permissions
Focus on the security aspects giving the ability to view selected data, sensitive information & only accessed by certain users.
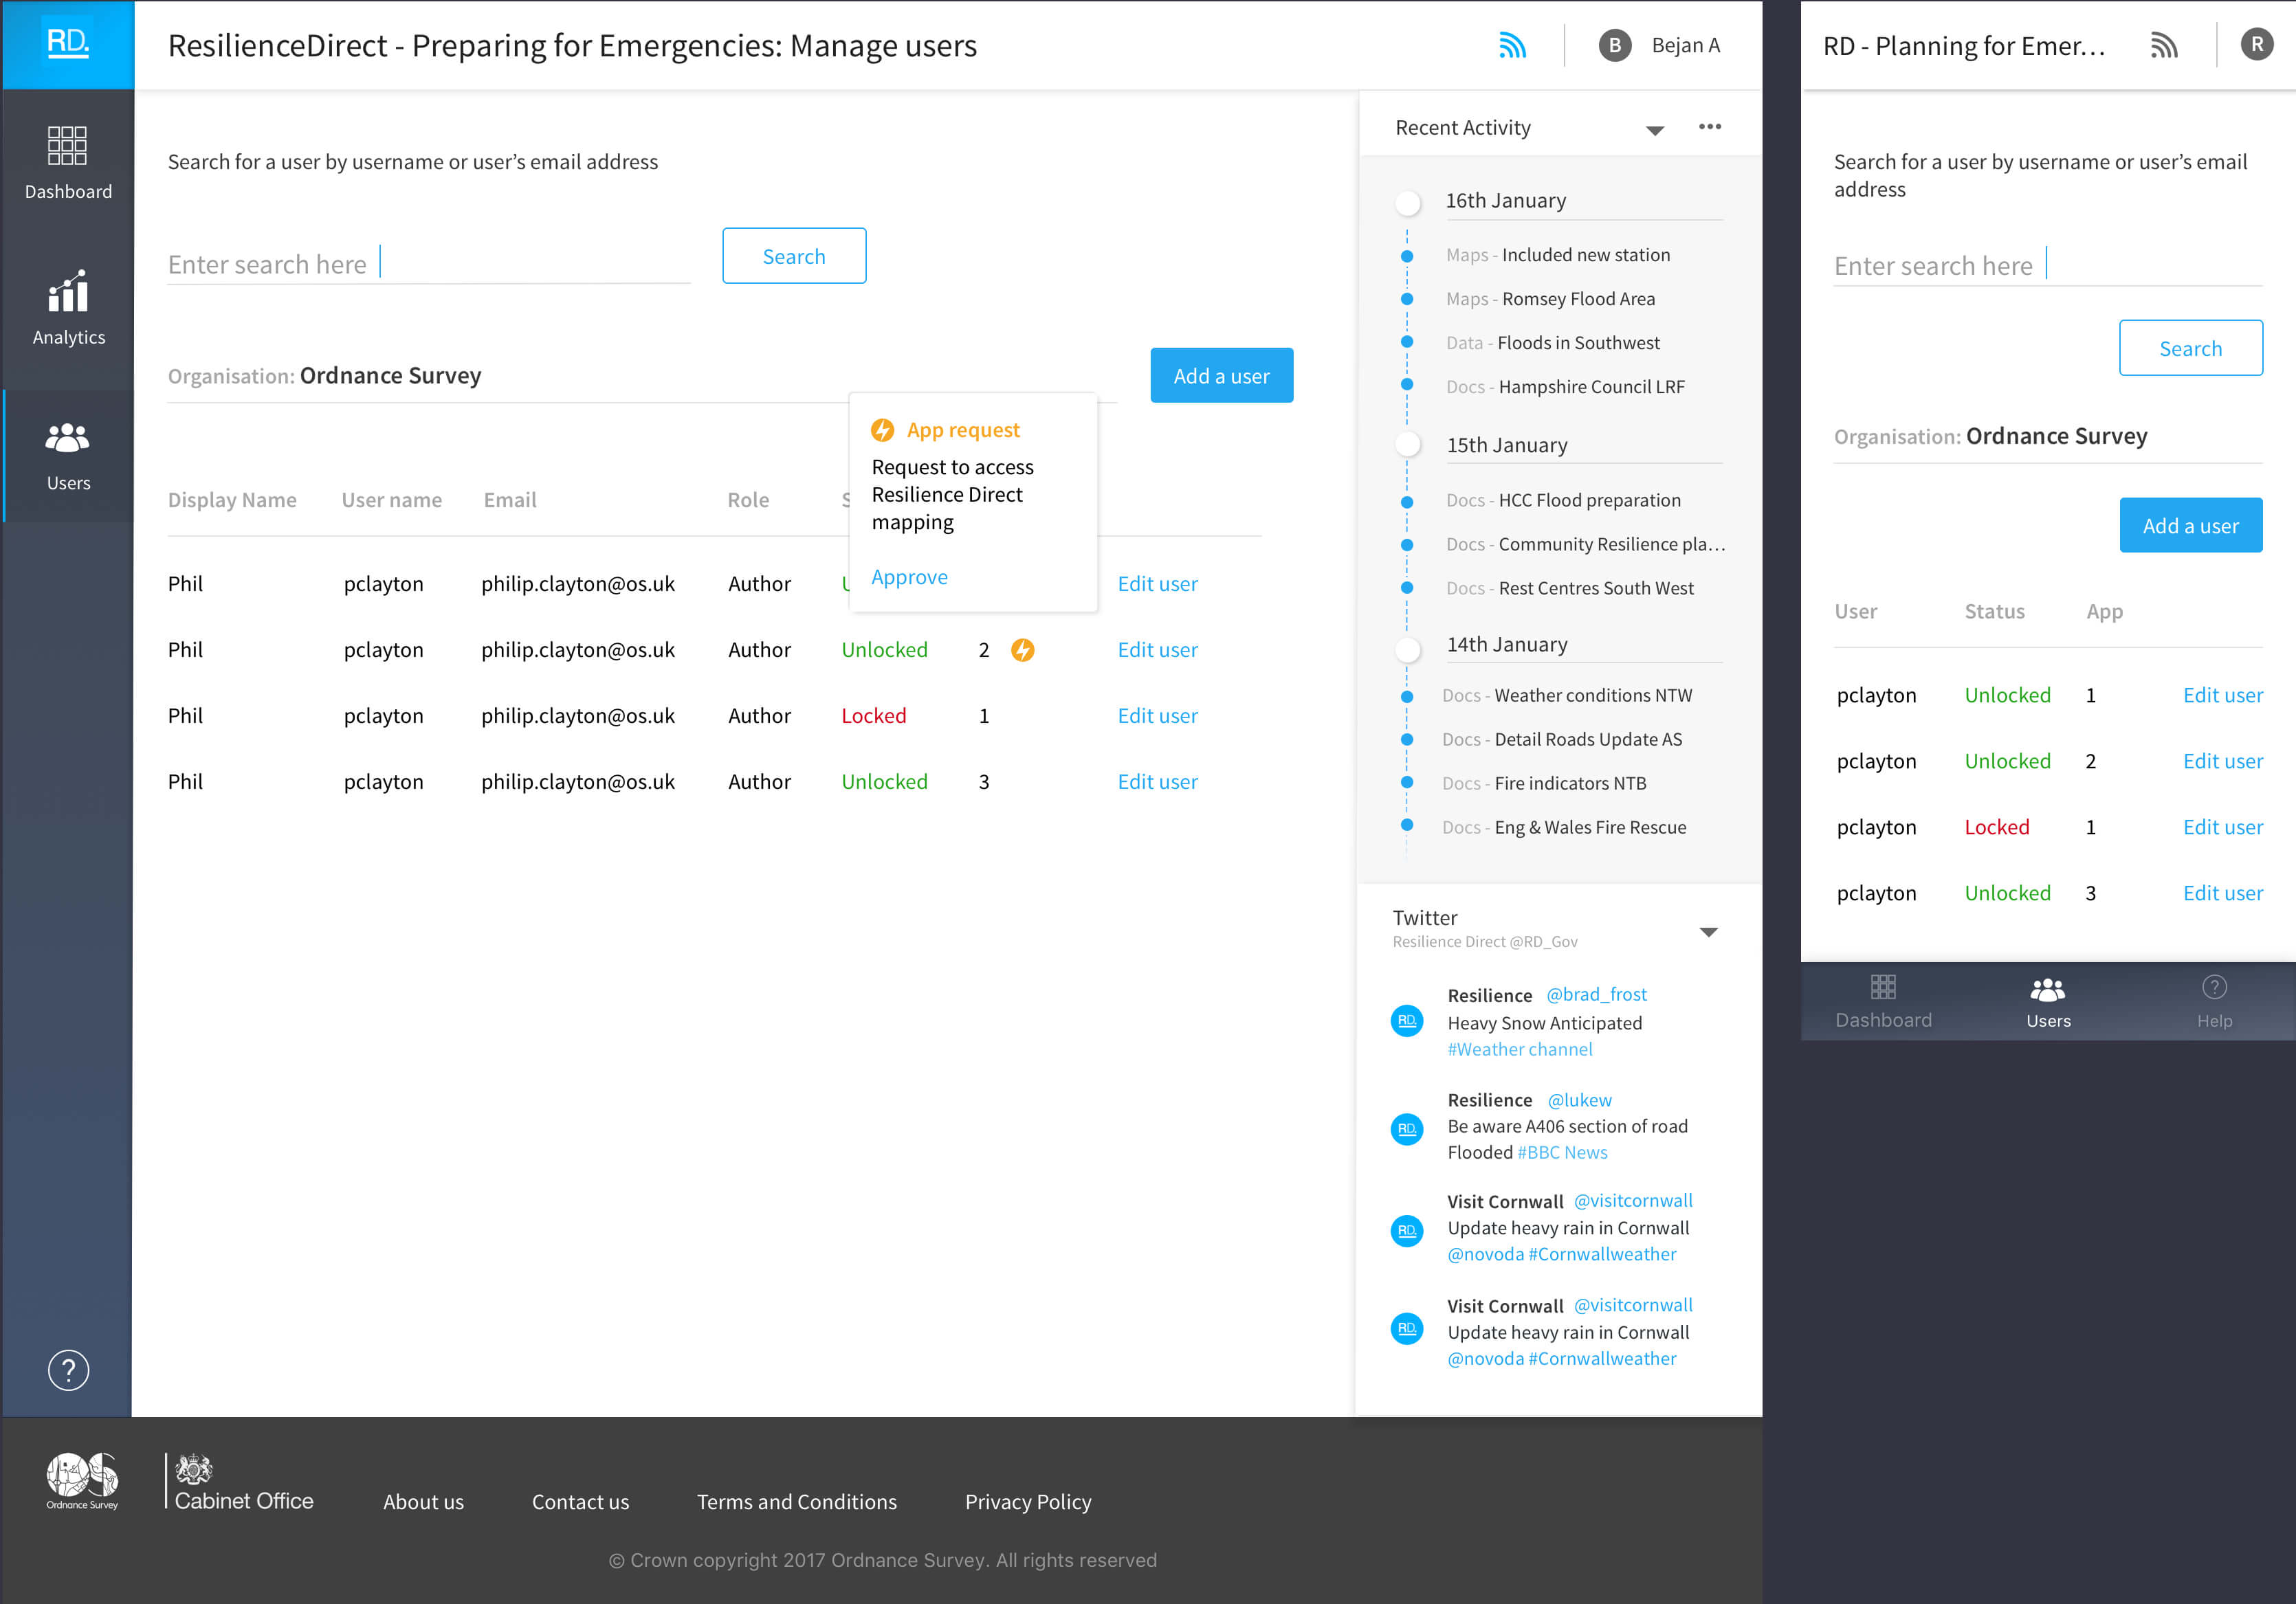
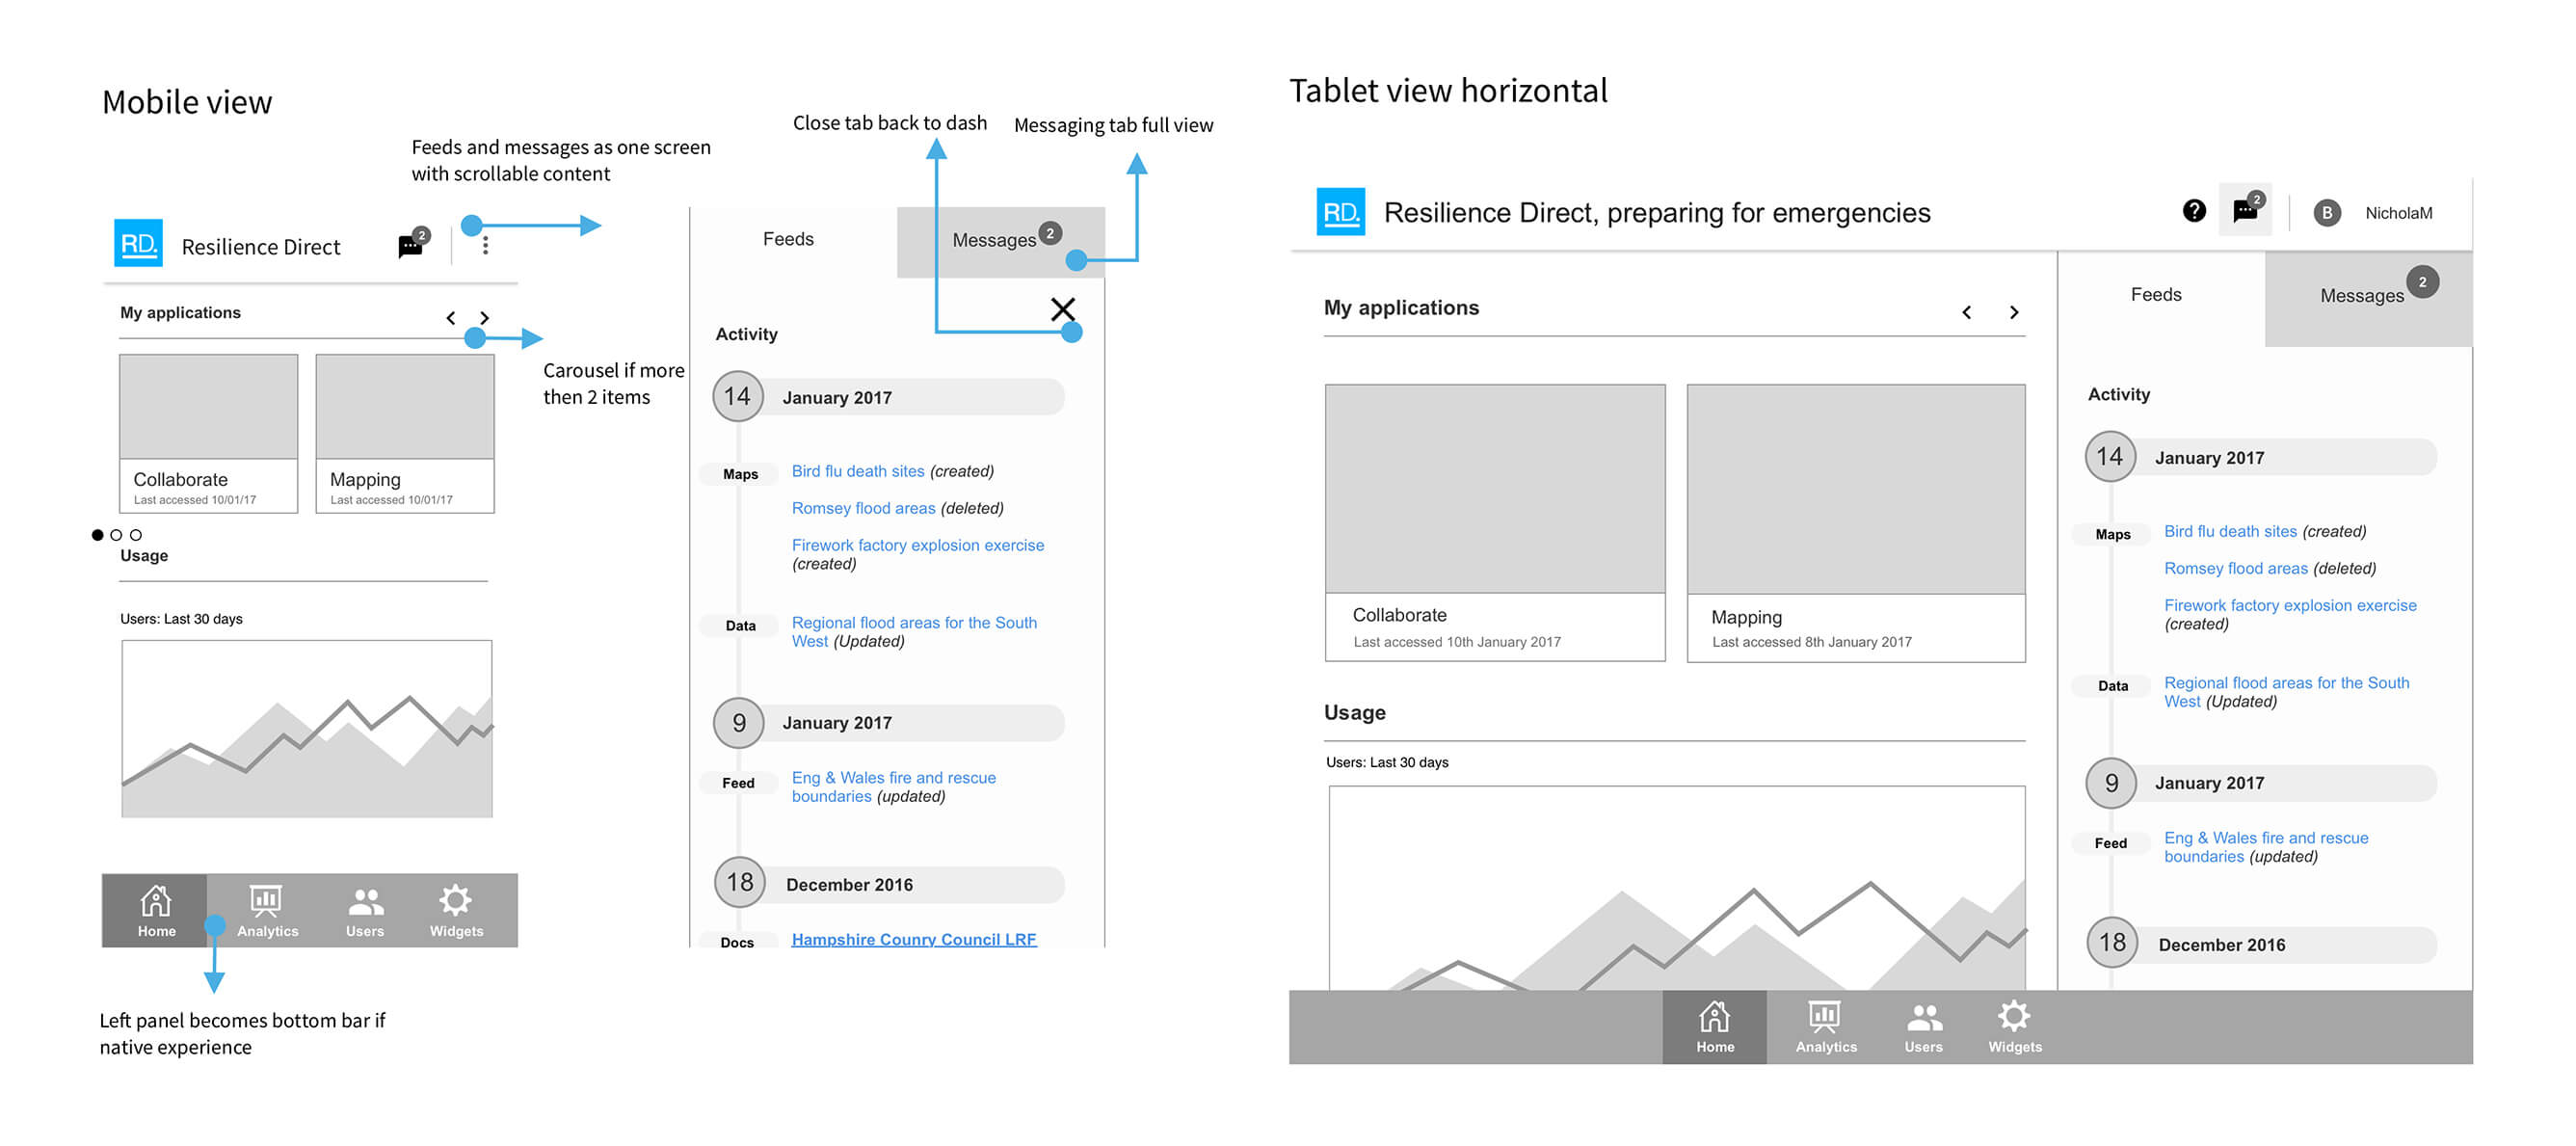
Multiple Platforms Tablet Portrait/Horizontal & Mobile
Building responsive for multiple platforms highlighting the activity feed in the visual below
Prototyping & Testing
Created Invision prototypes which were shared with stakeholders, I also created surveys with hypothetical tasks for them to do on the prototype before the product went to development, this involved iteration and minor improvements.
Outcome
Handover to the devs for them to build, they were in sync with the project throughout. The internal continued to build on the product when my contract came to an end, they reported there was a lot more activity on the platform most of the COBRA & Internal OS teams were using the platform daily.
Key Learnings
More regular contact with the devs to keep them informed of stakeholder & business requirement decisions which will affect the build, involving them very earlier in the process.
Strive to build successful digital products through evidence — based design
Don’t be a stranger, contact me below anytime. I'm always interested to hear about new projects.
© BEJANPAUL 2022
© BEJANPAUL 2022